GIS support from the Harvard Map Collection

Atlas viewer, Atlascope, a GIS tool from the Boston Public Library.
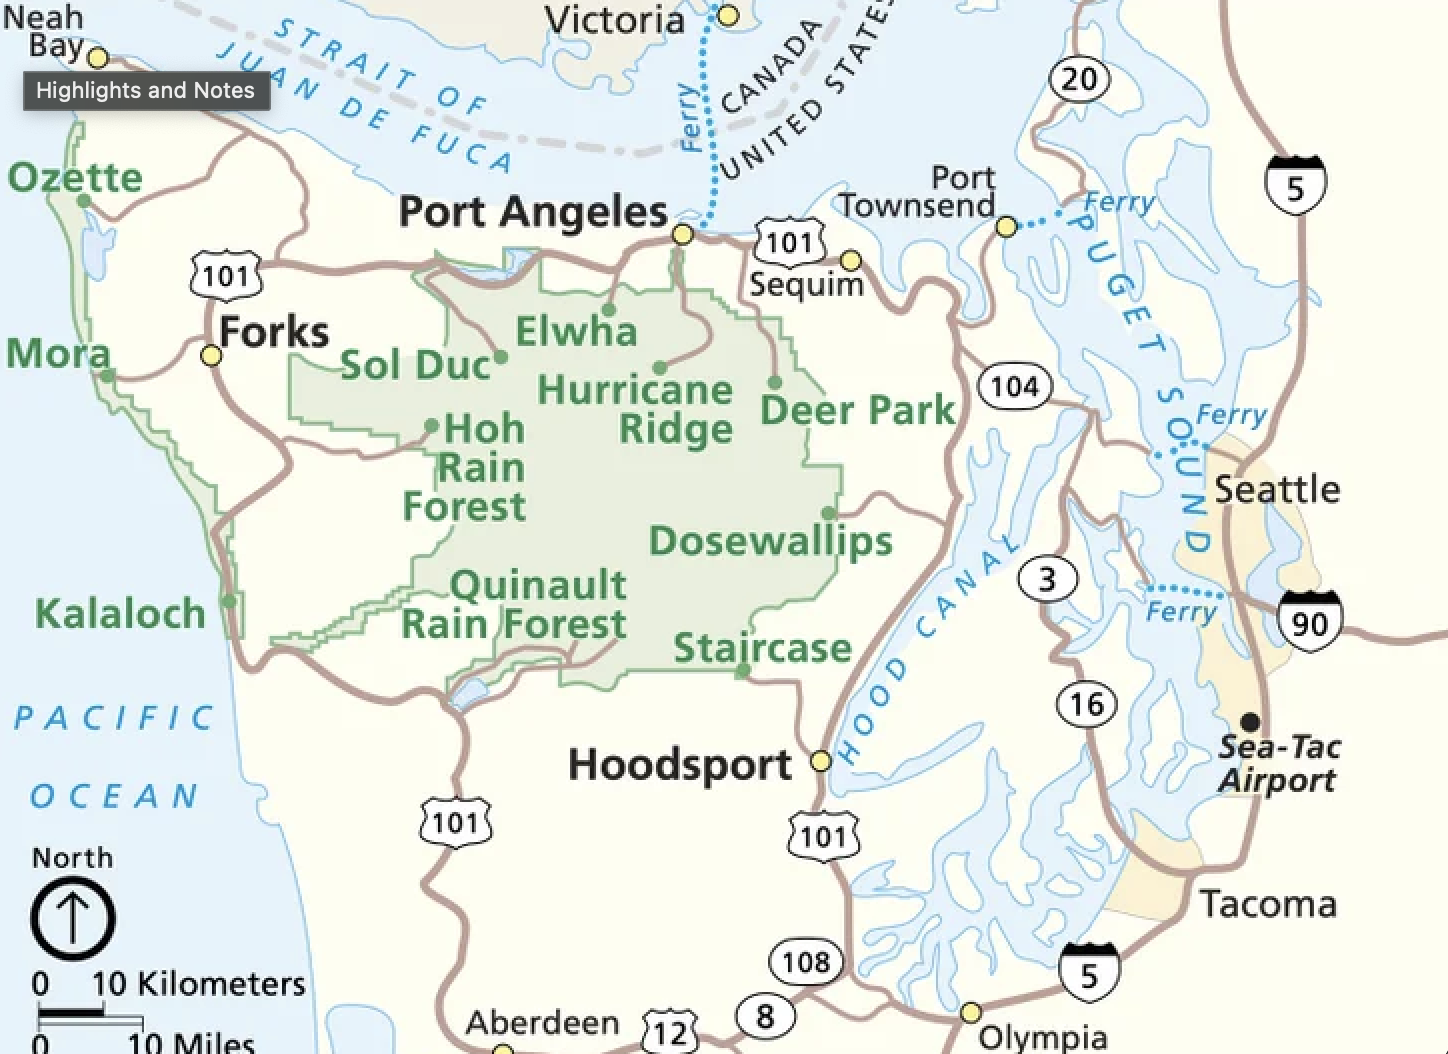 Offical Olympic National Park map.
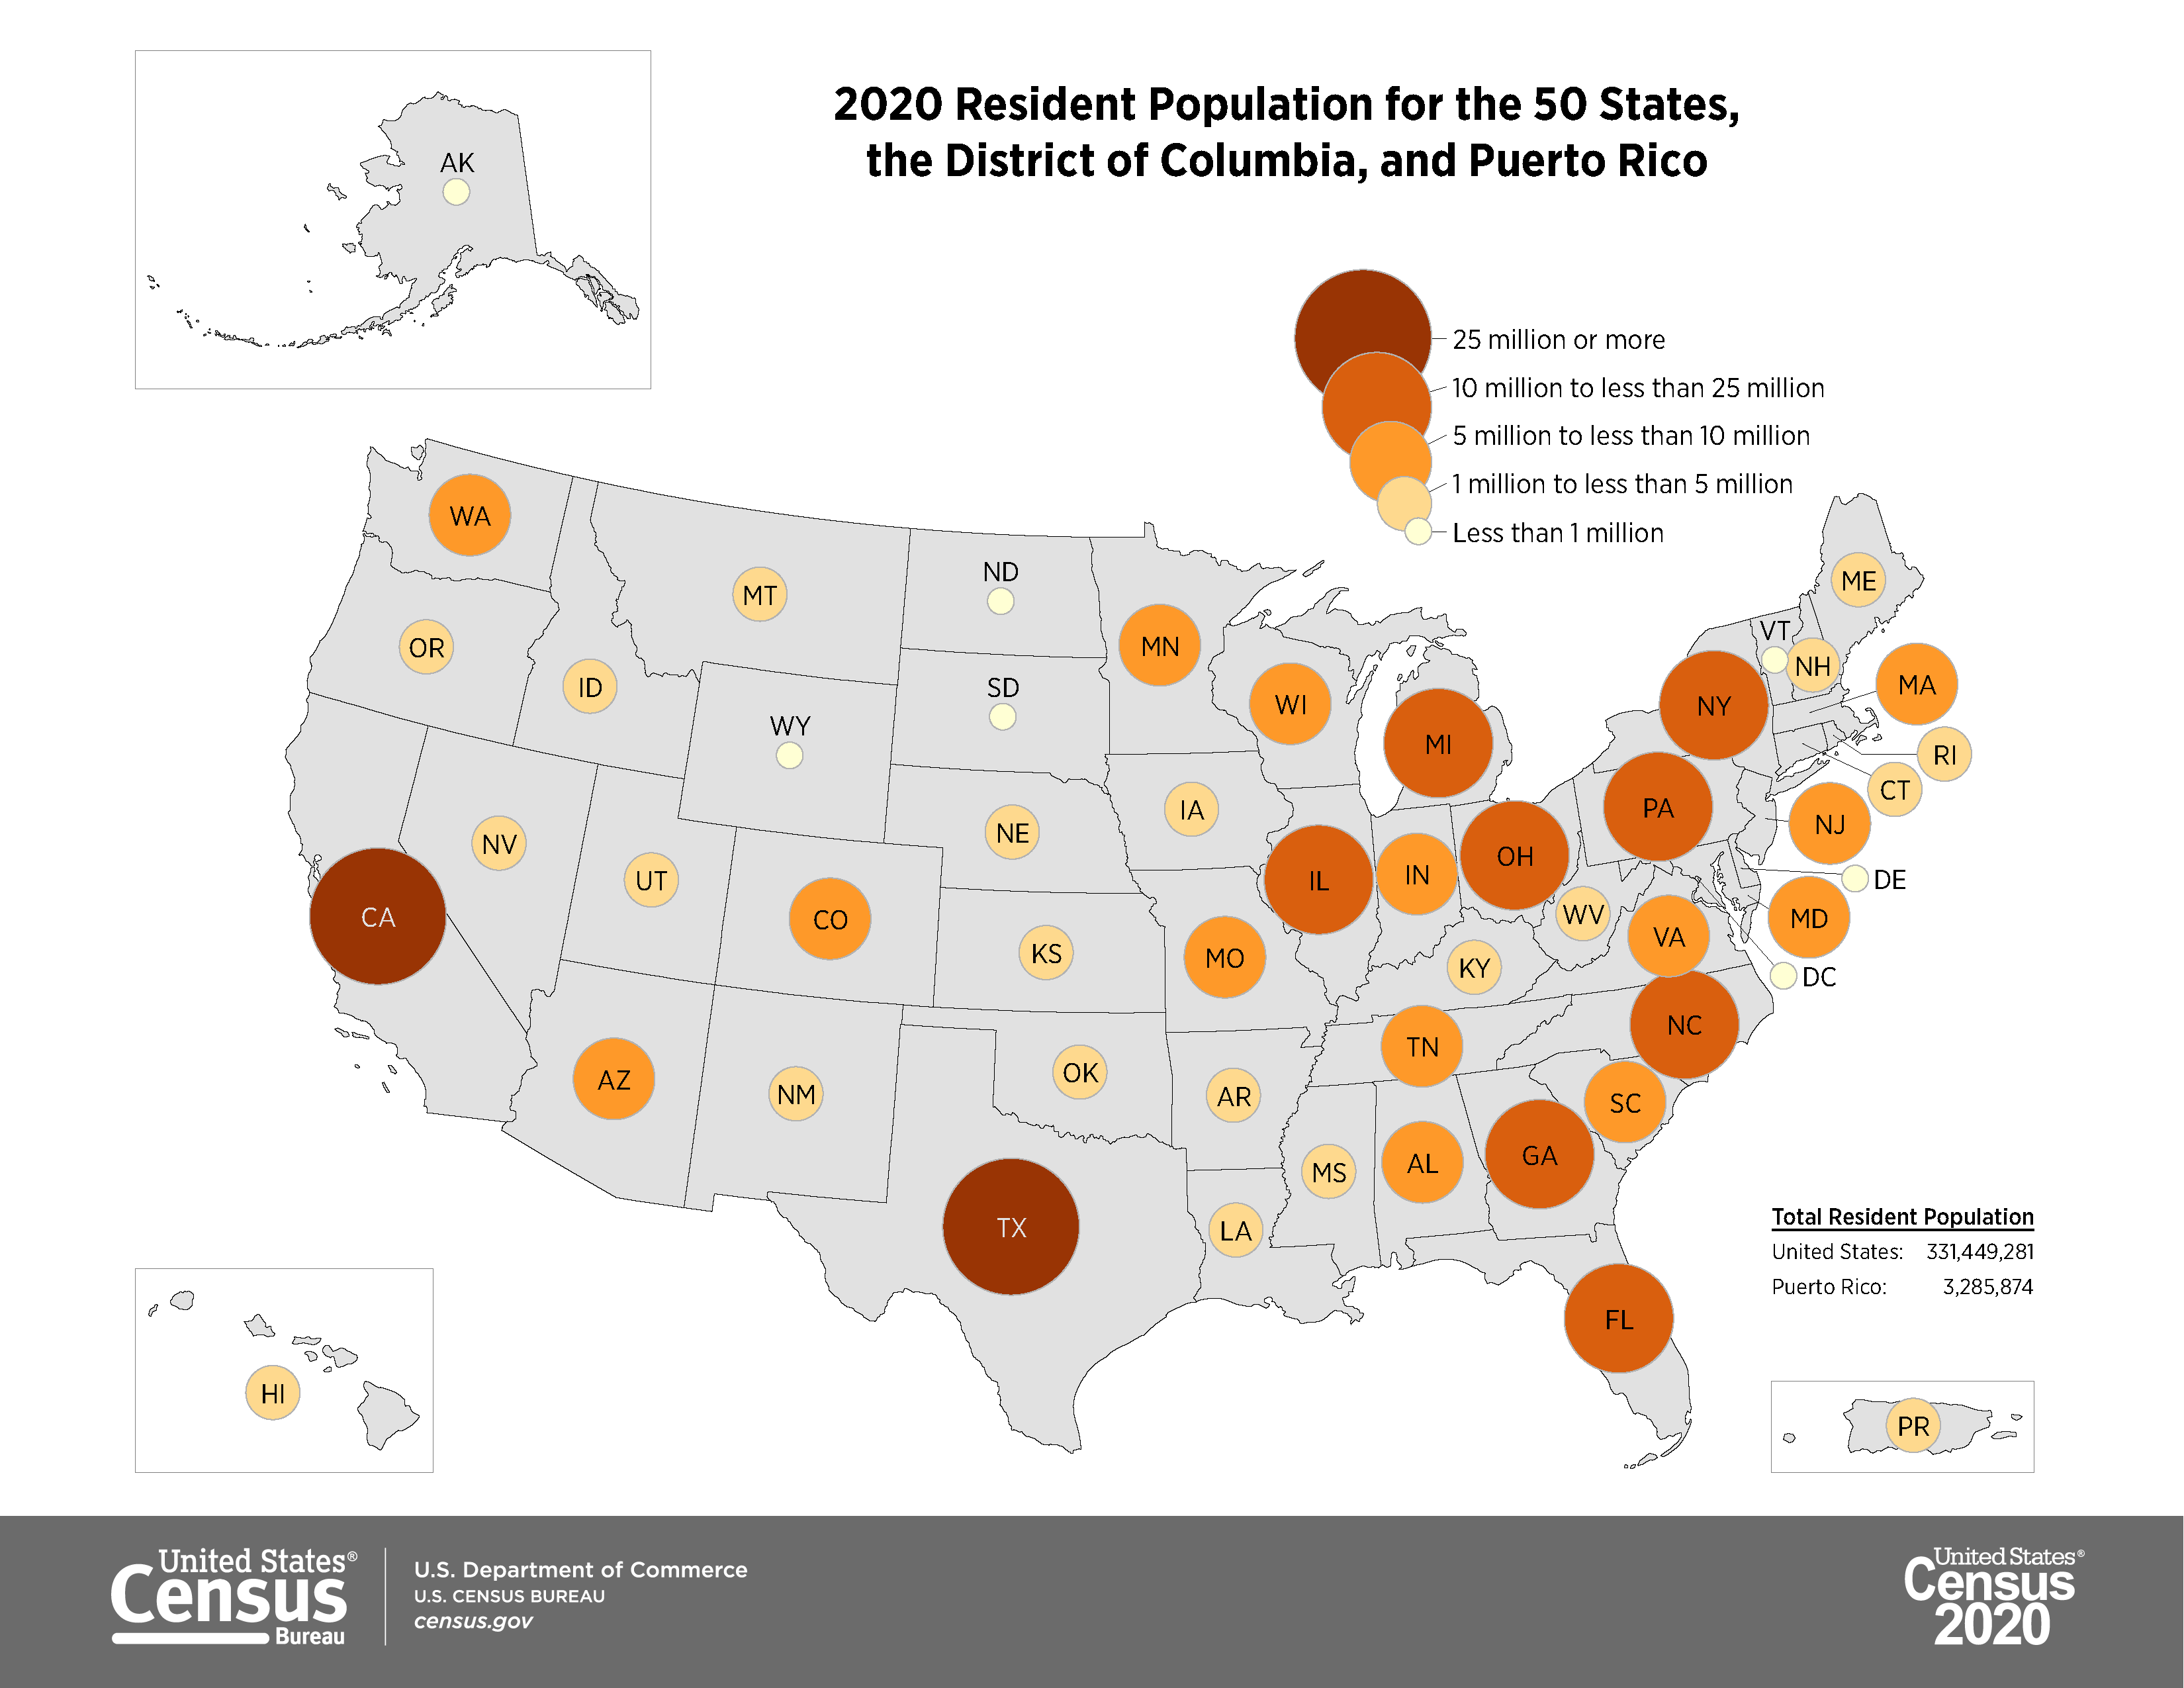 Graduated proportional symbol map showing 2020 population by state in the United States.
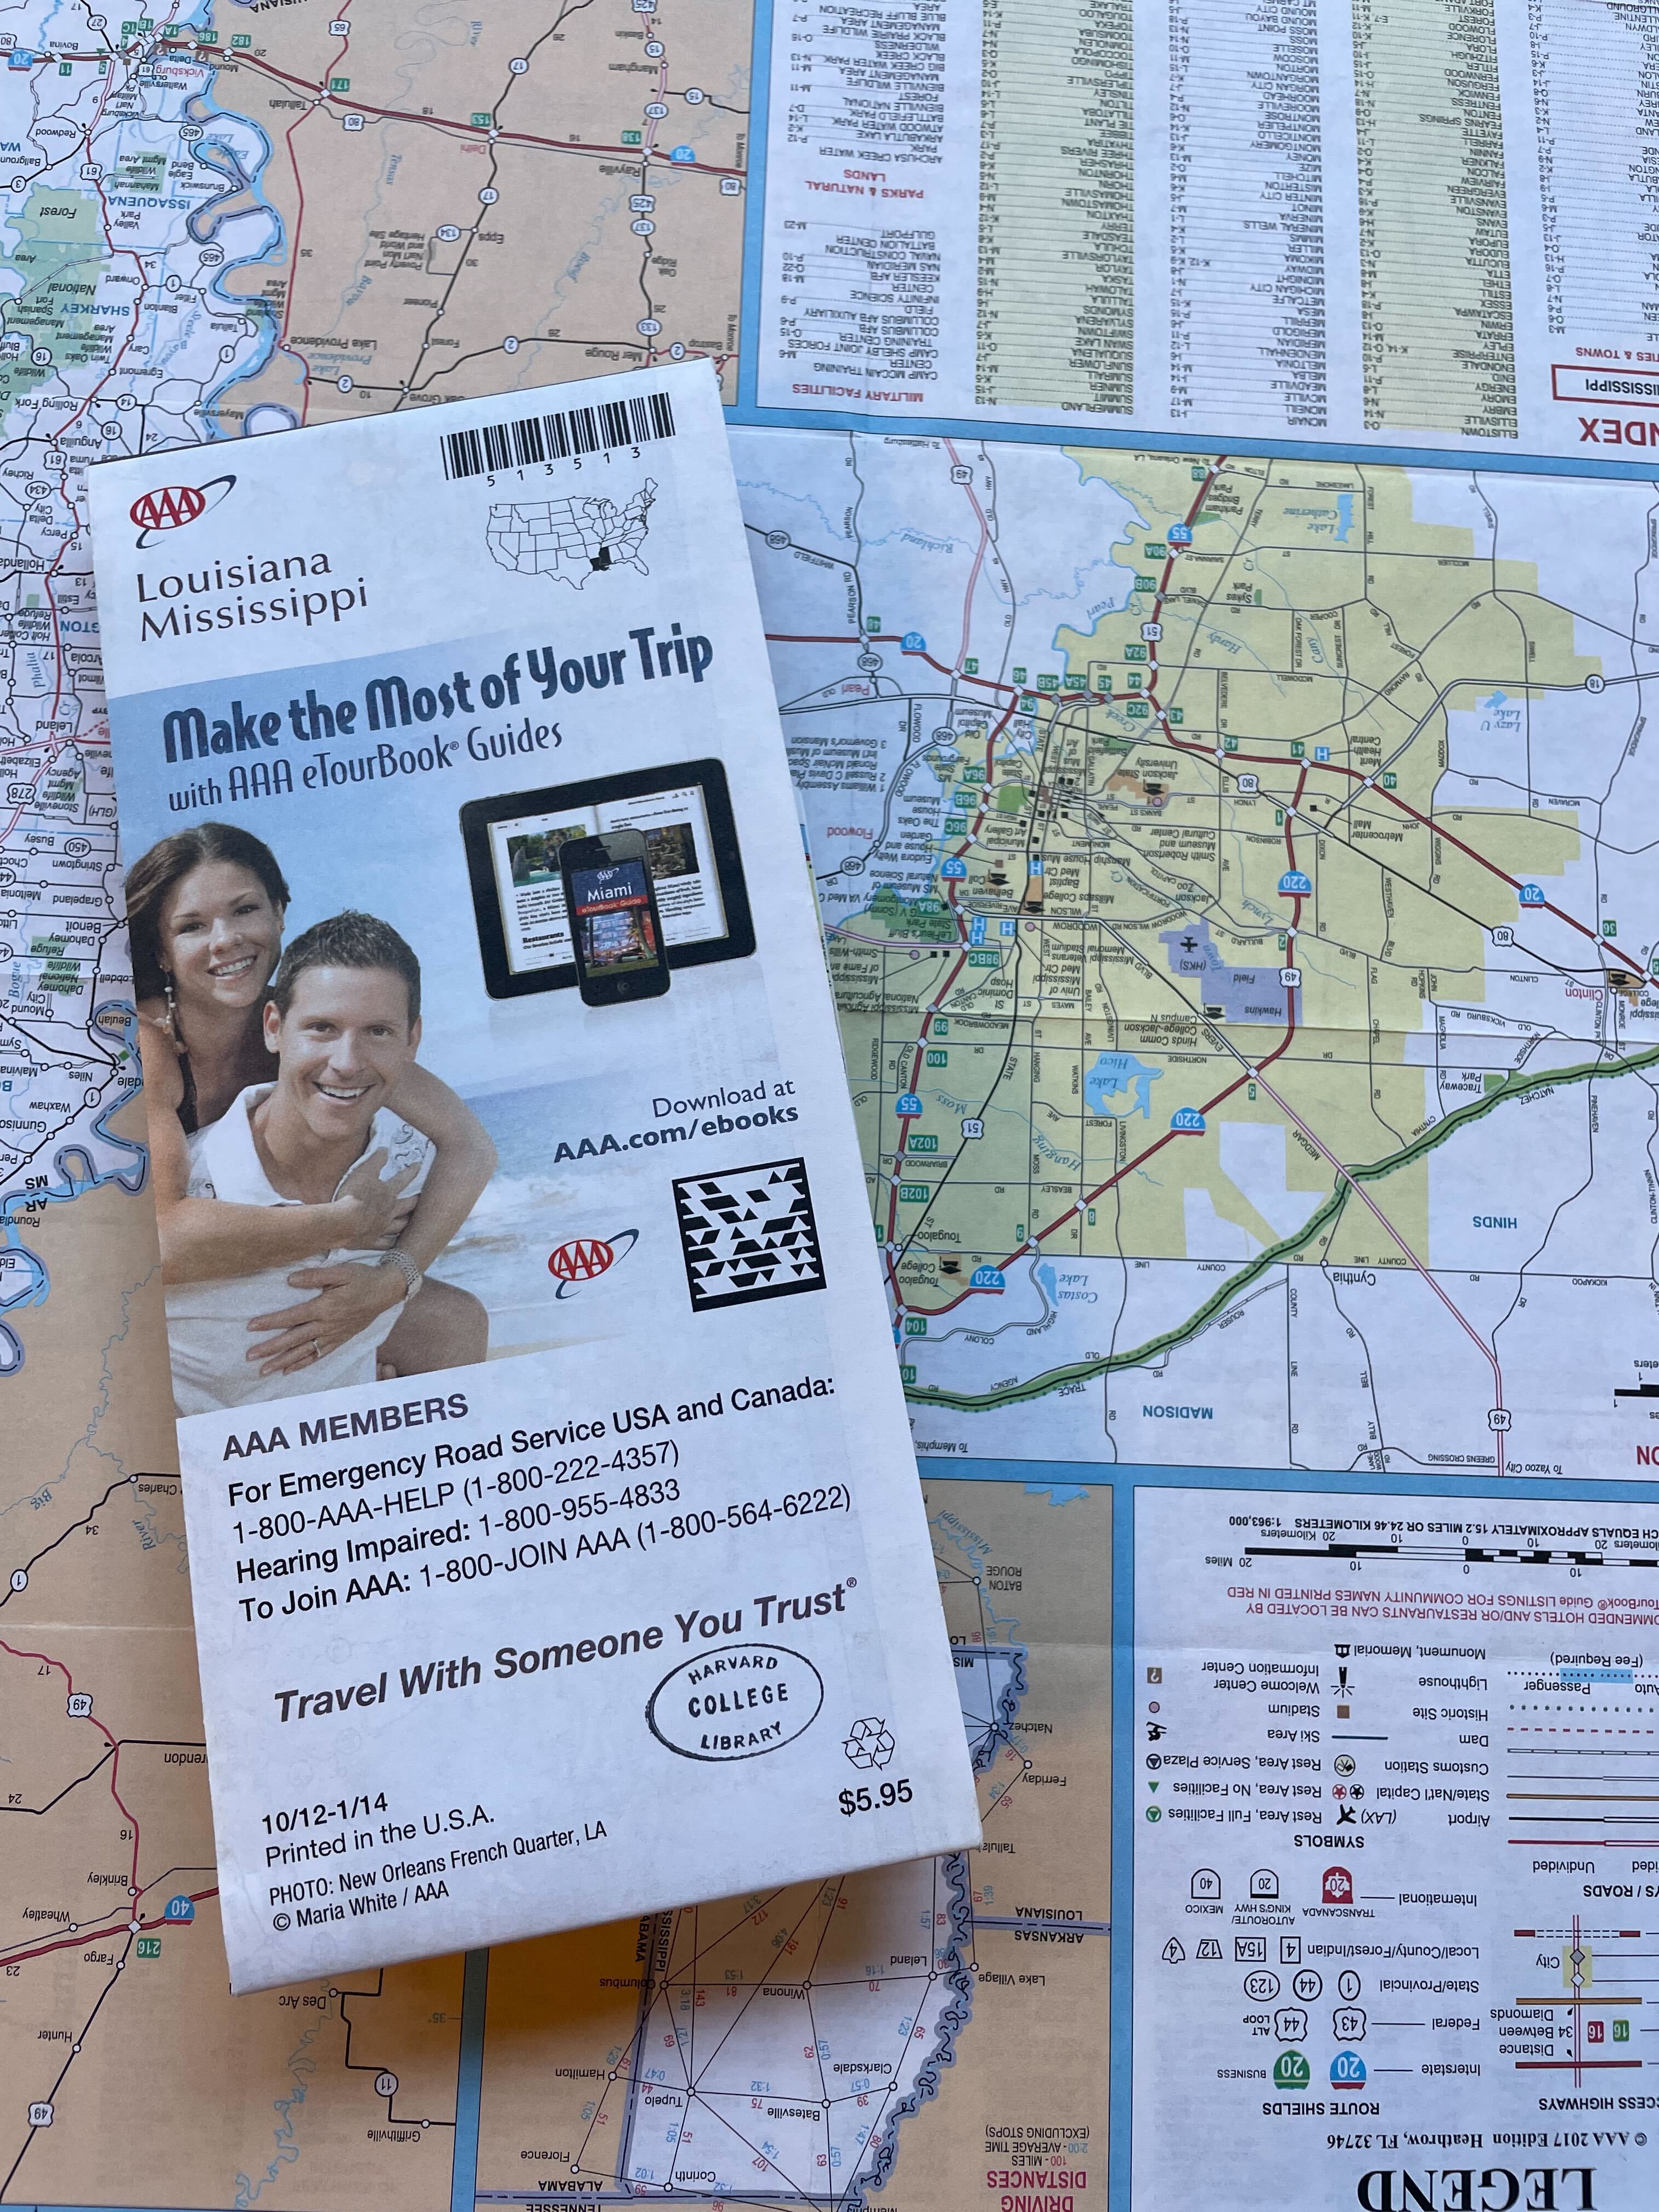 Louisiana and Mississippi roadmap from the Harvard Map Collection.
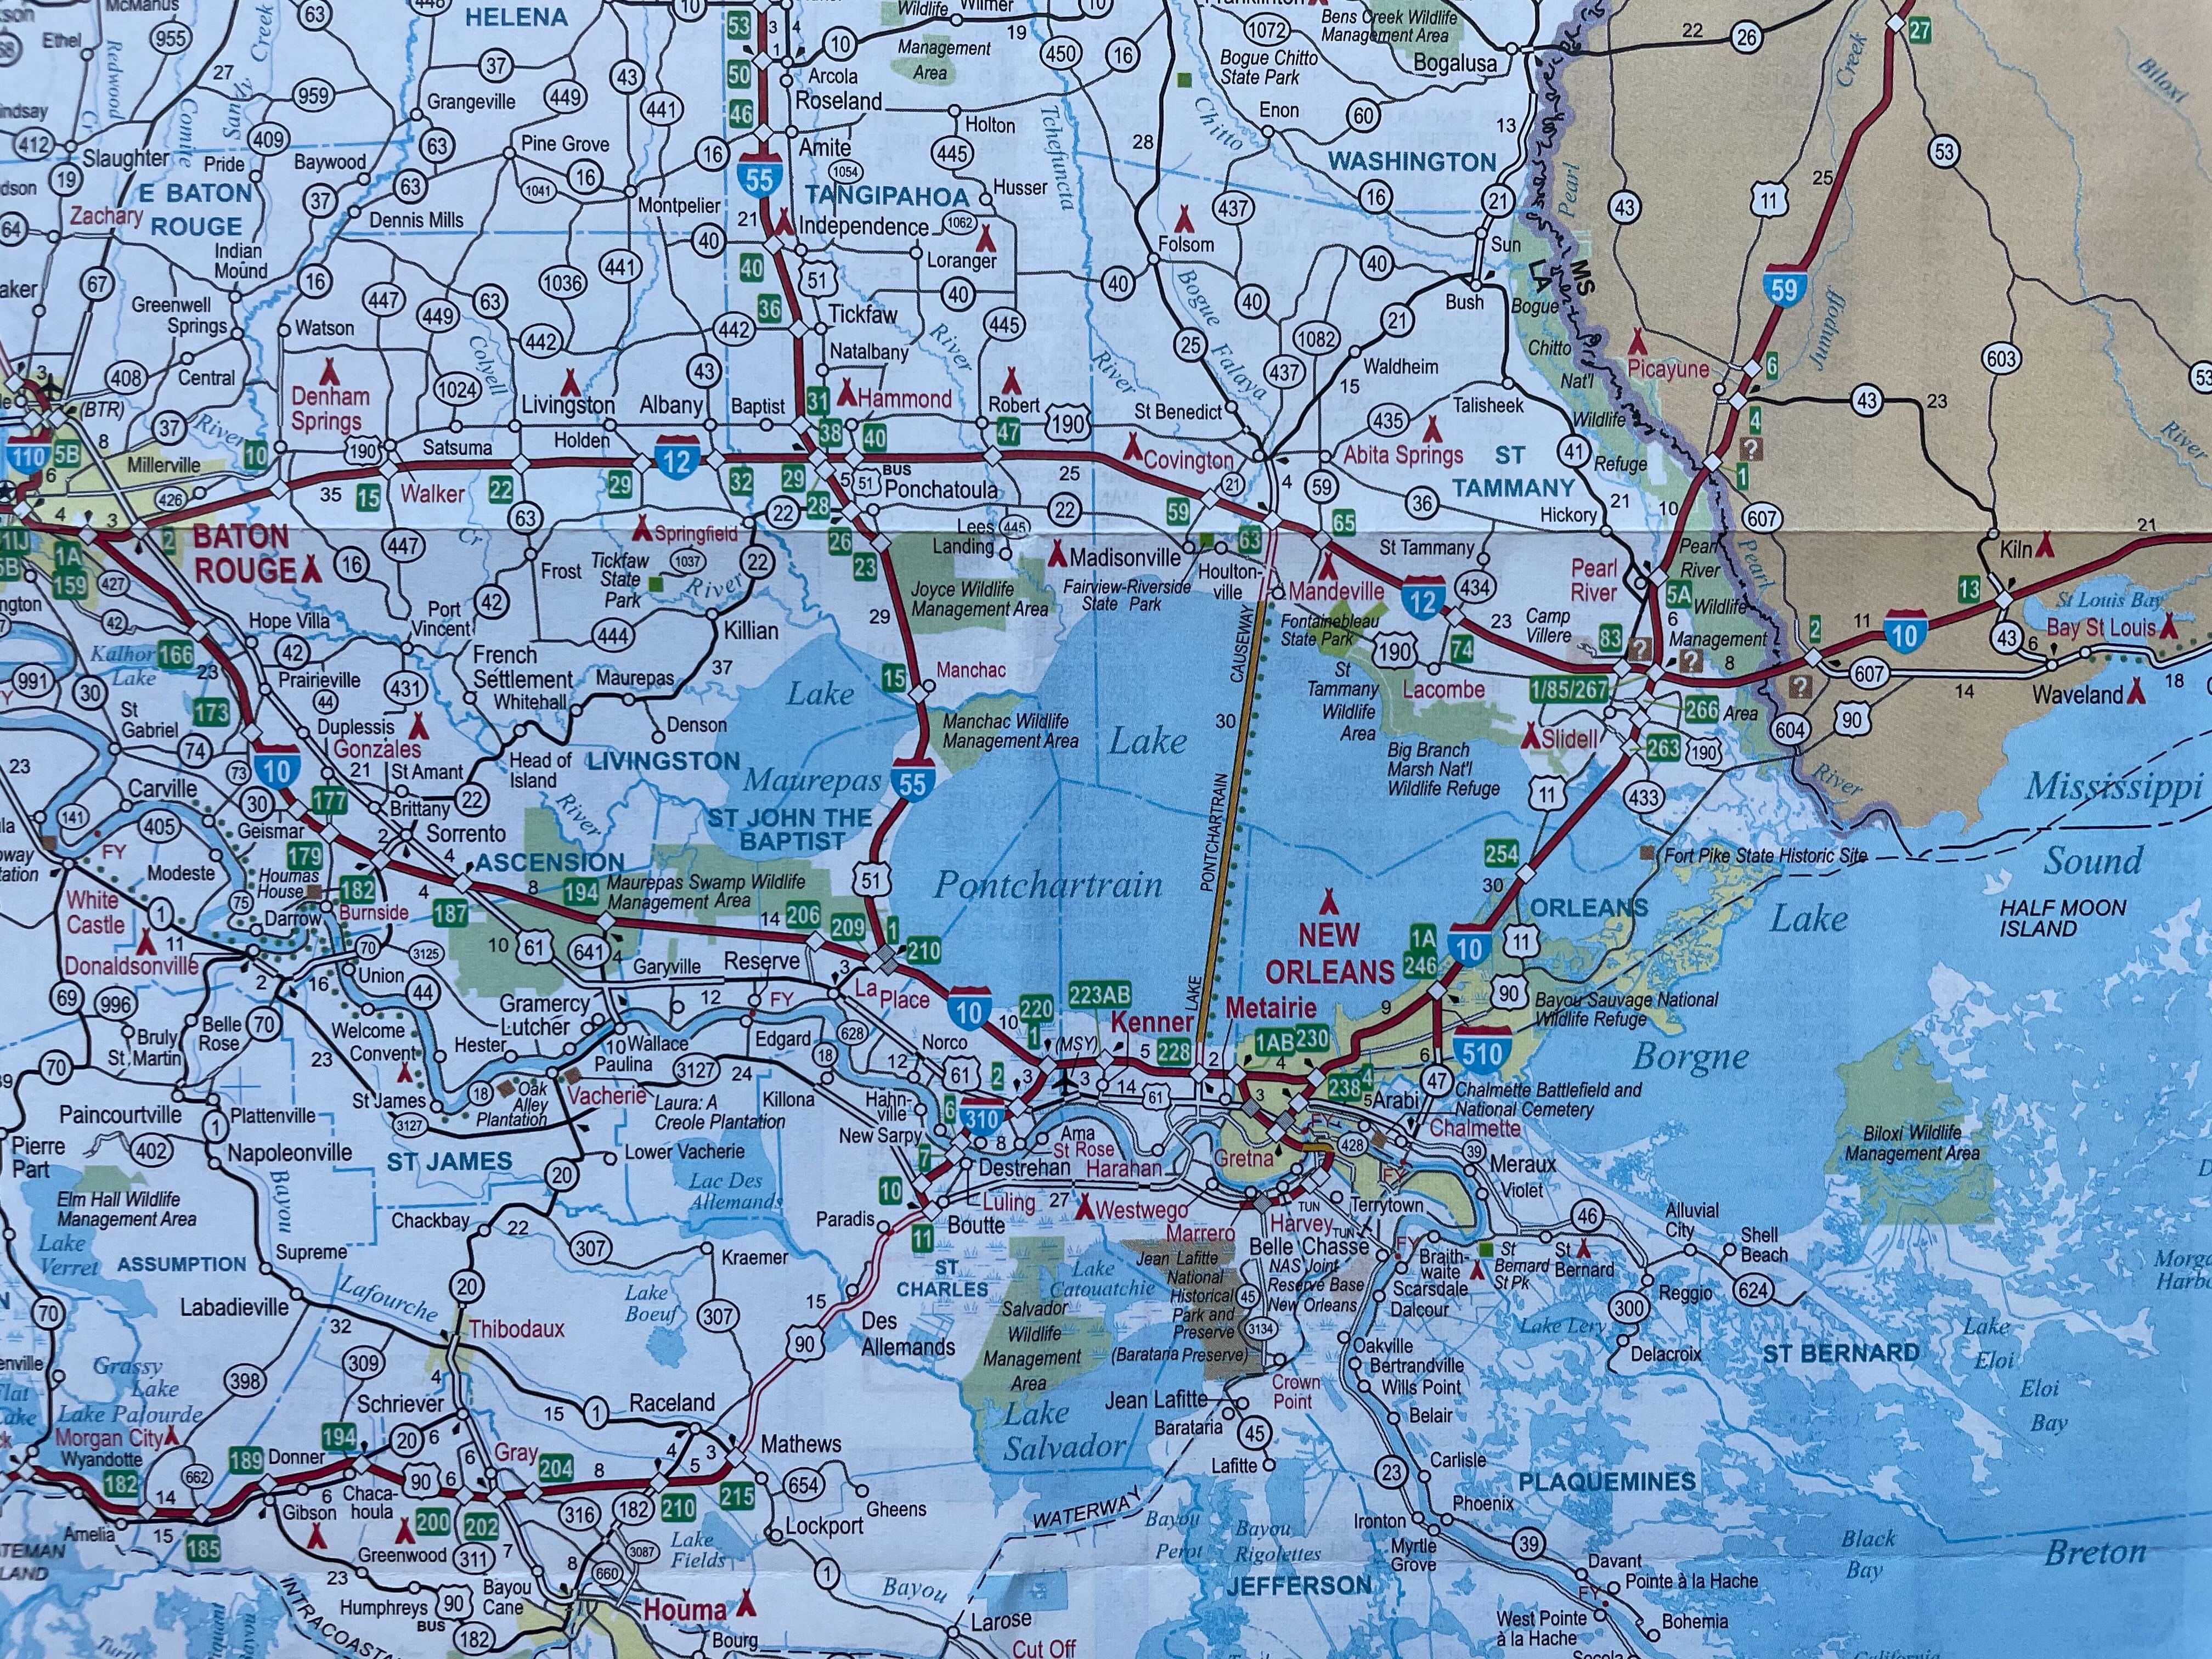 Louisiana and Mississippi roadmap from the Harvard Map Collection showing the New Orleans area.
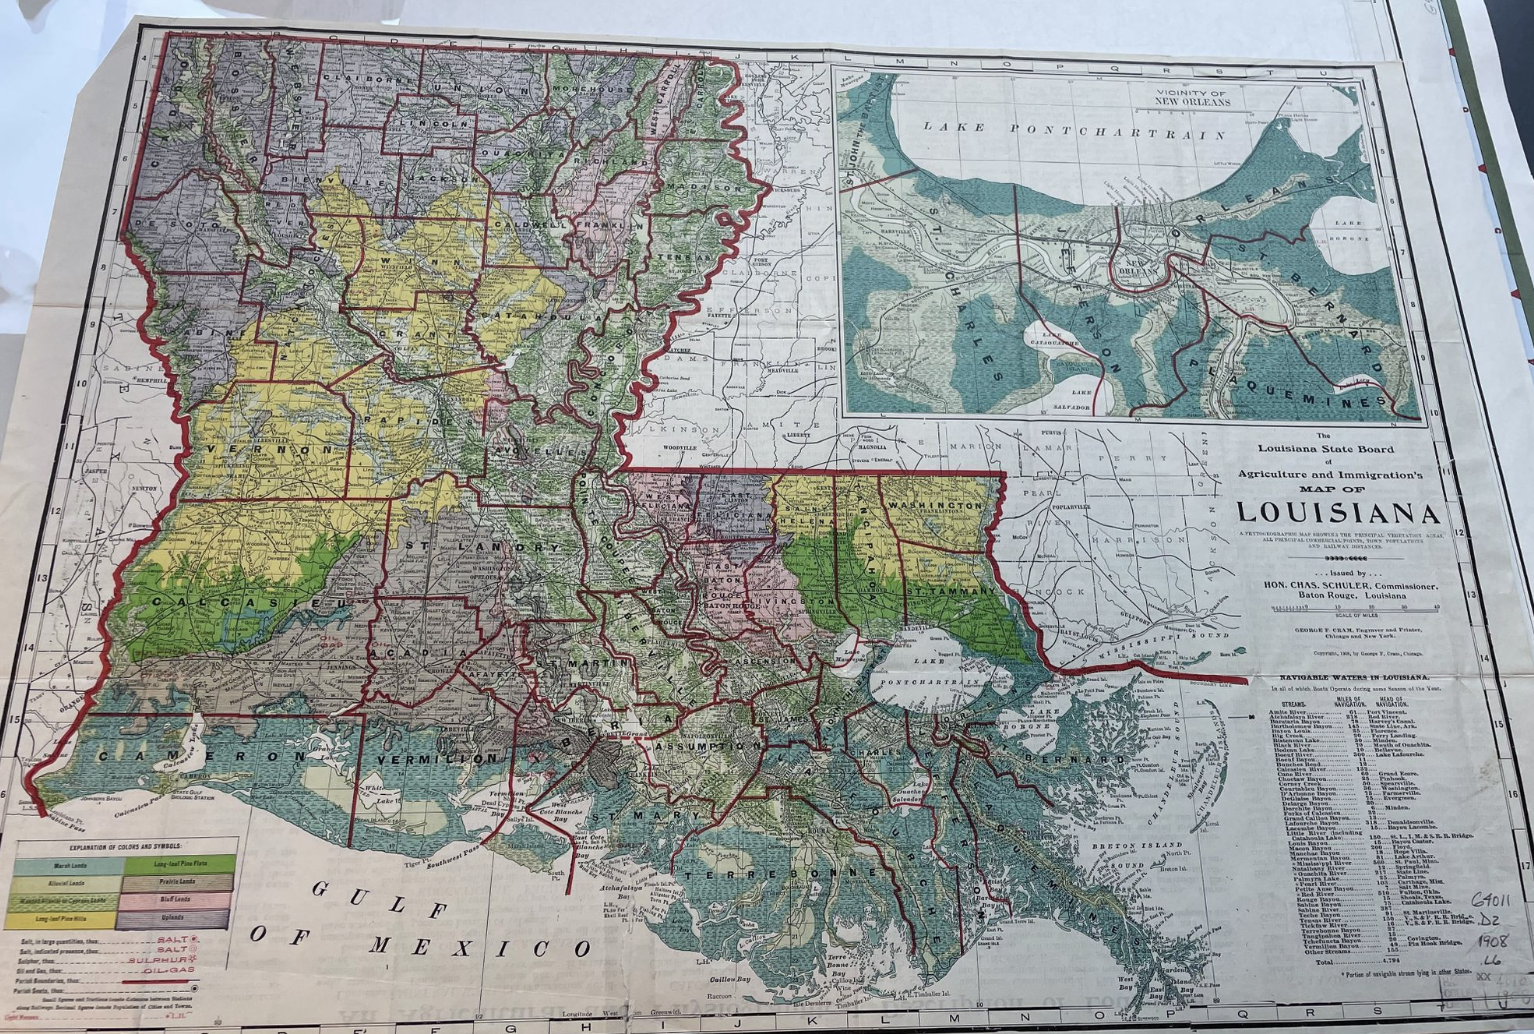 Land cover map of Louisiana from 1909 in the Harvard Map Collection.
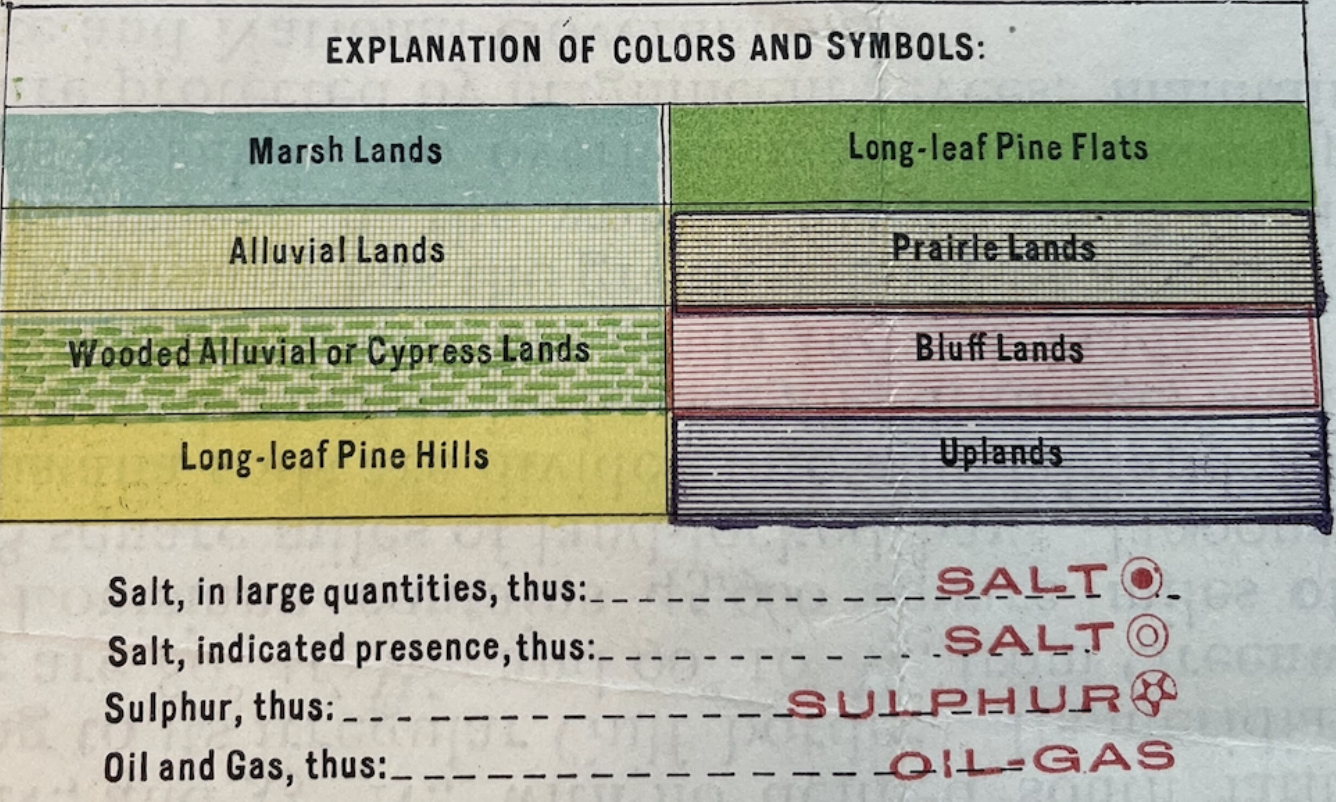 The legend of the 1909 land cover map of Louisiana.
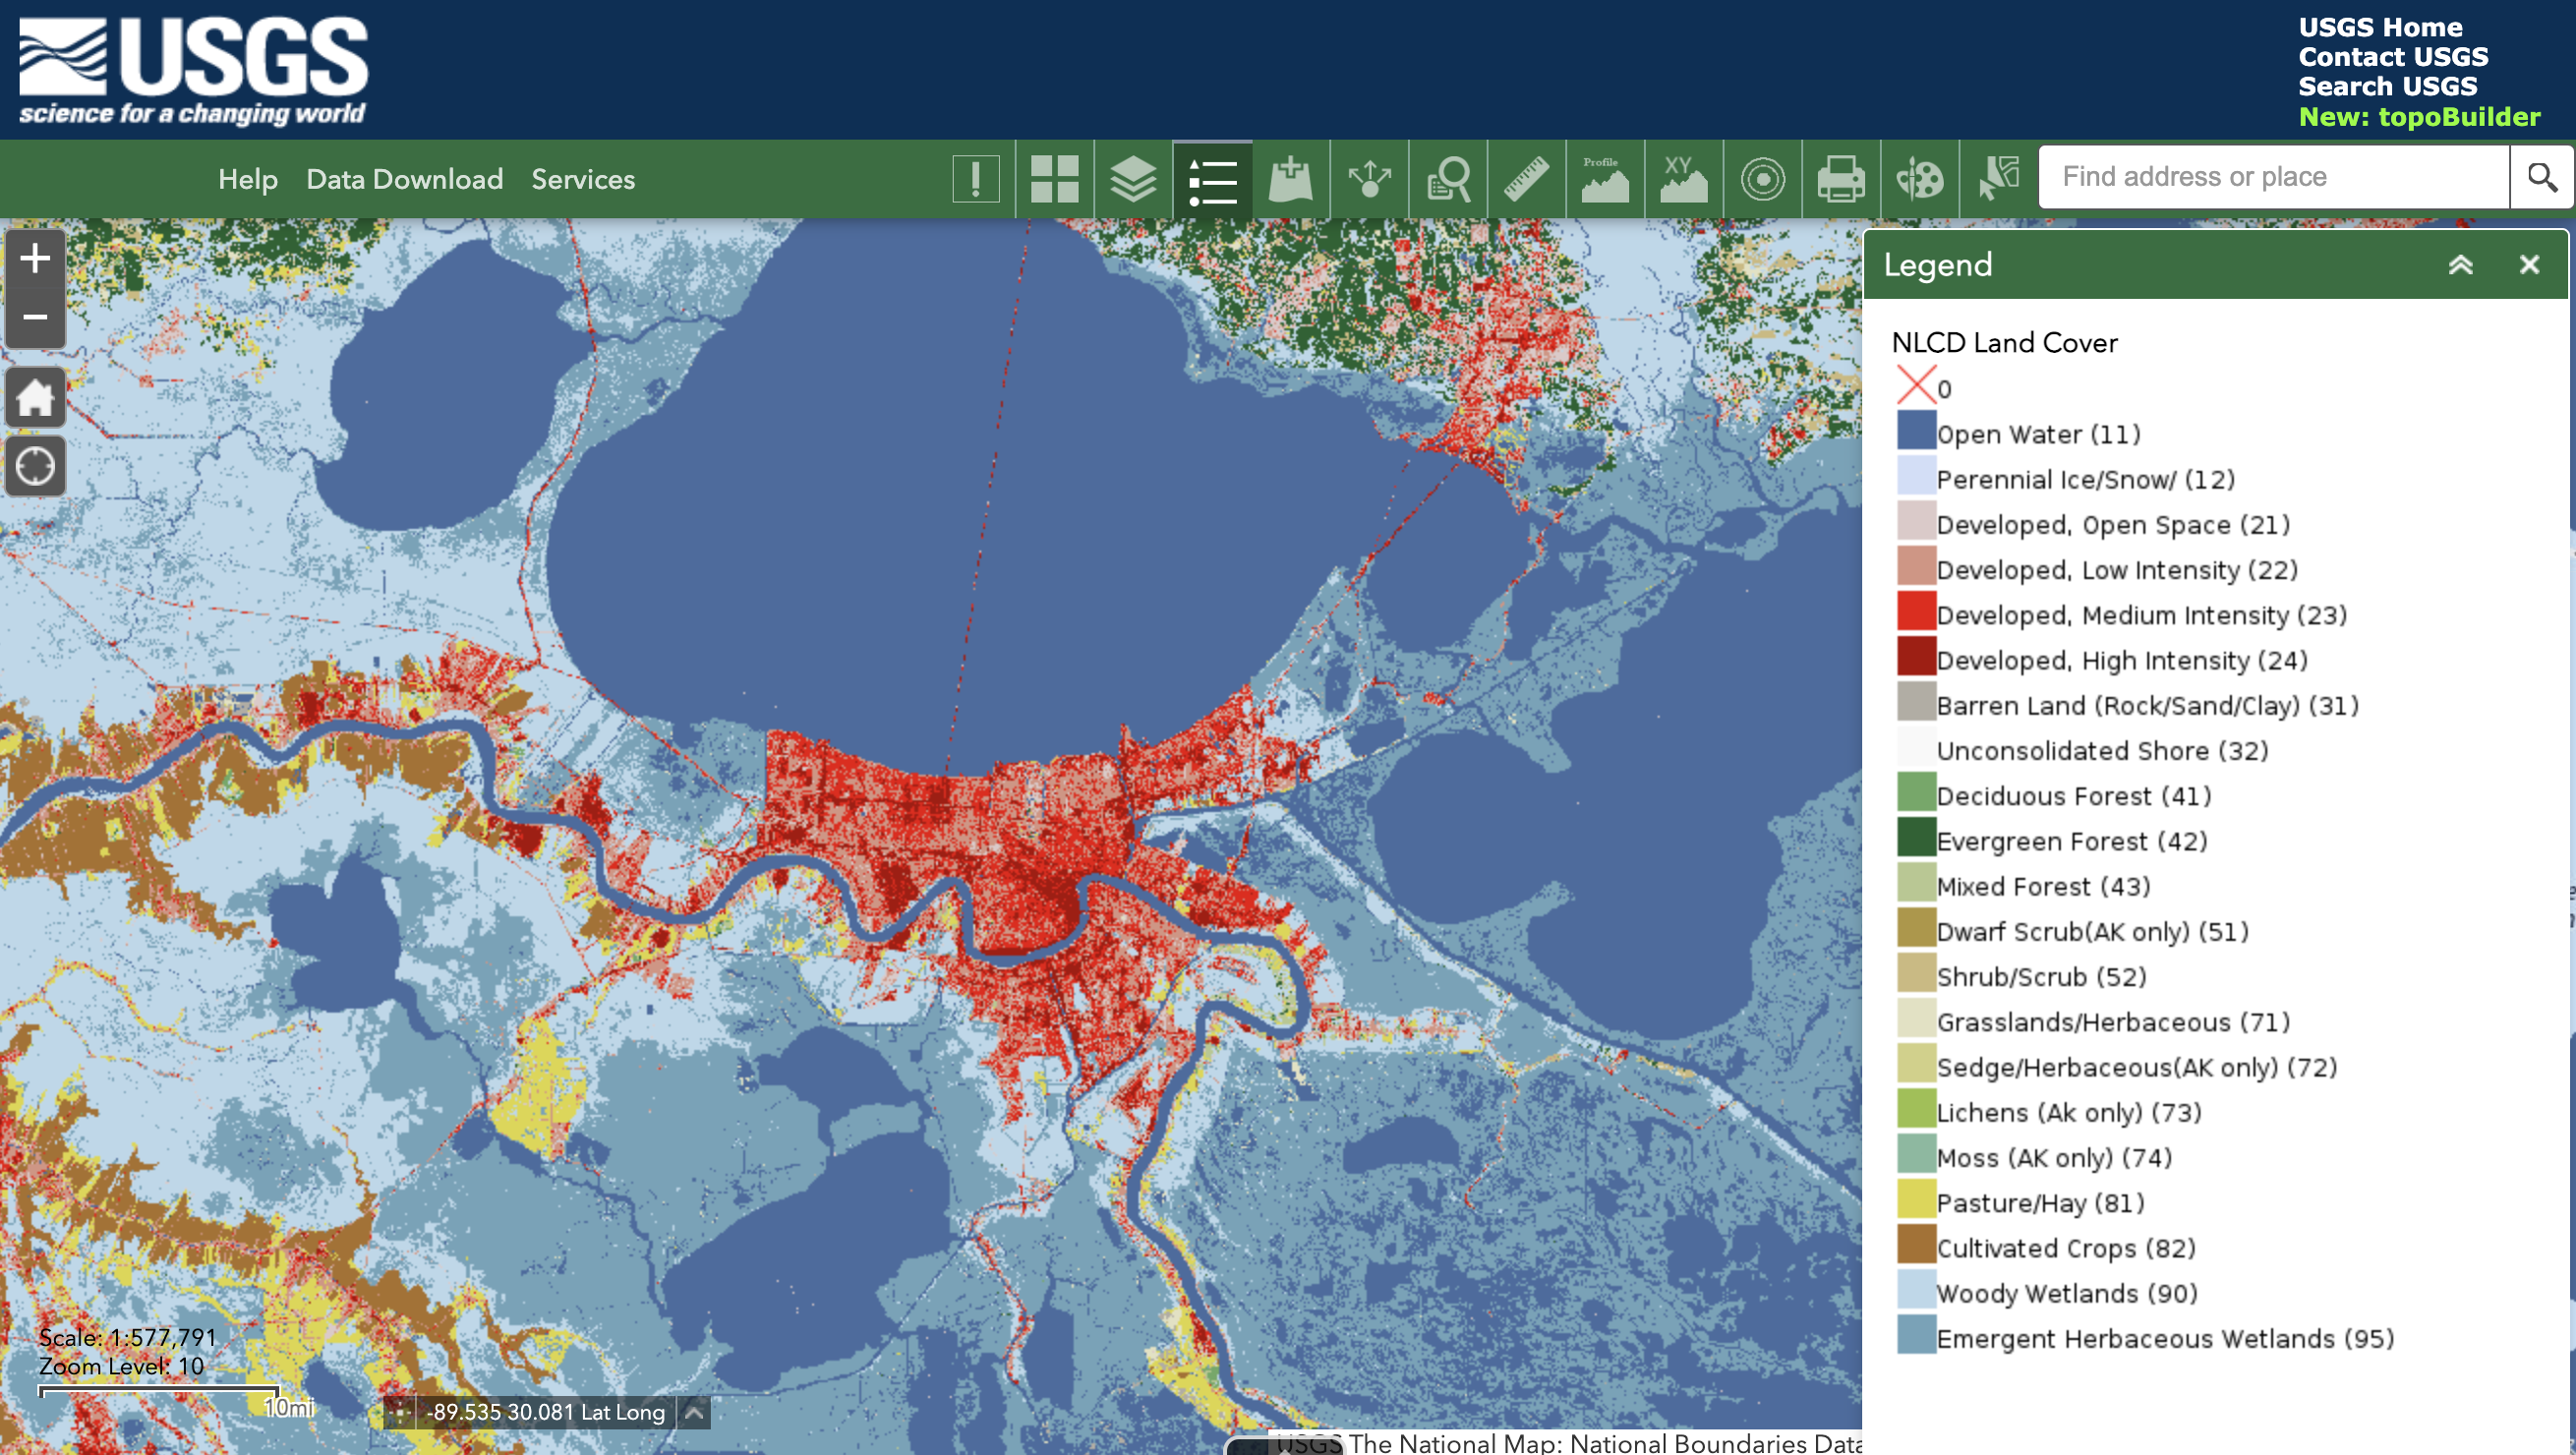 USGS data download tool, showing land cover data from 2016.
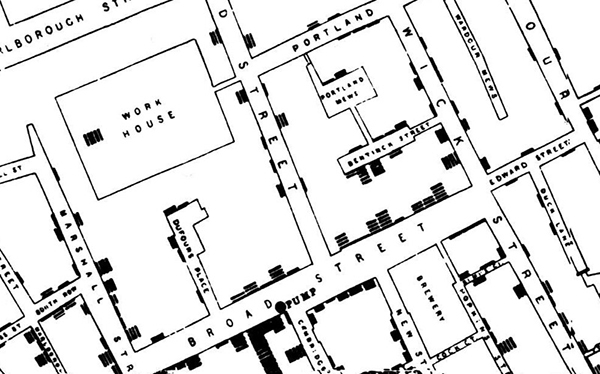
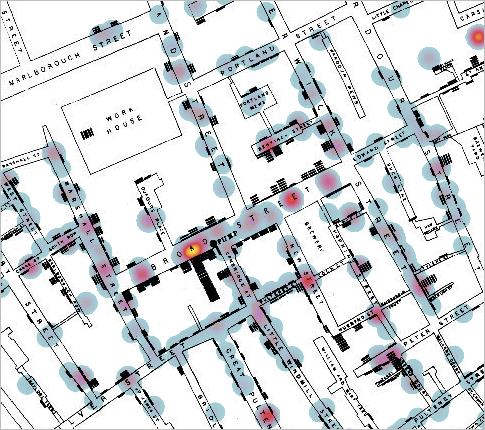

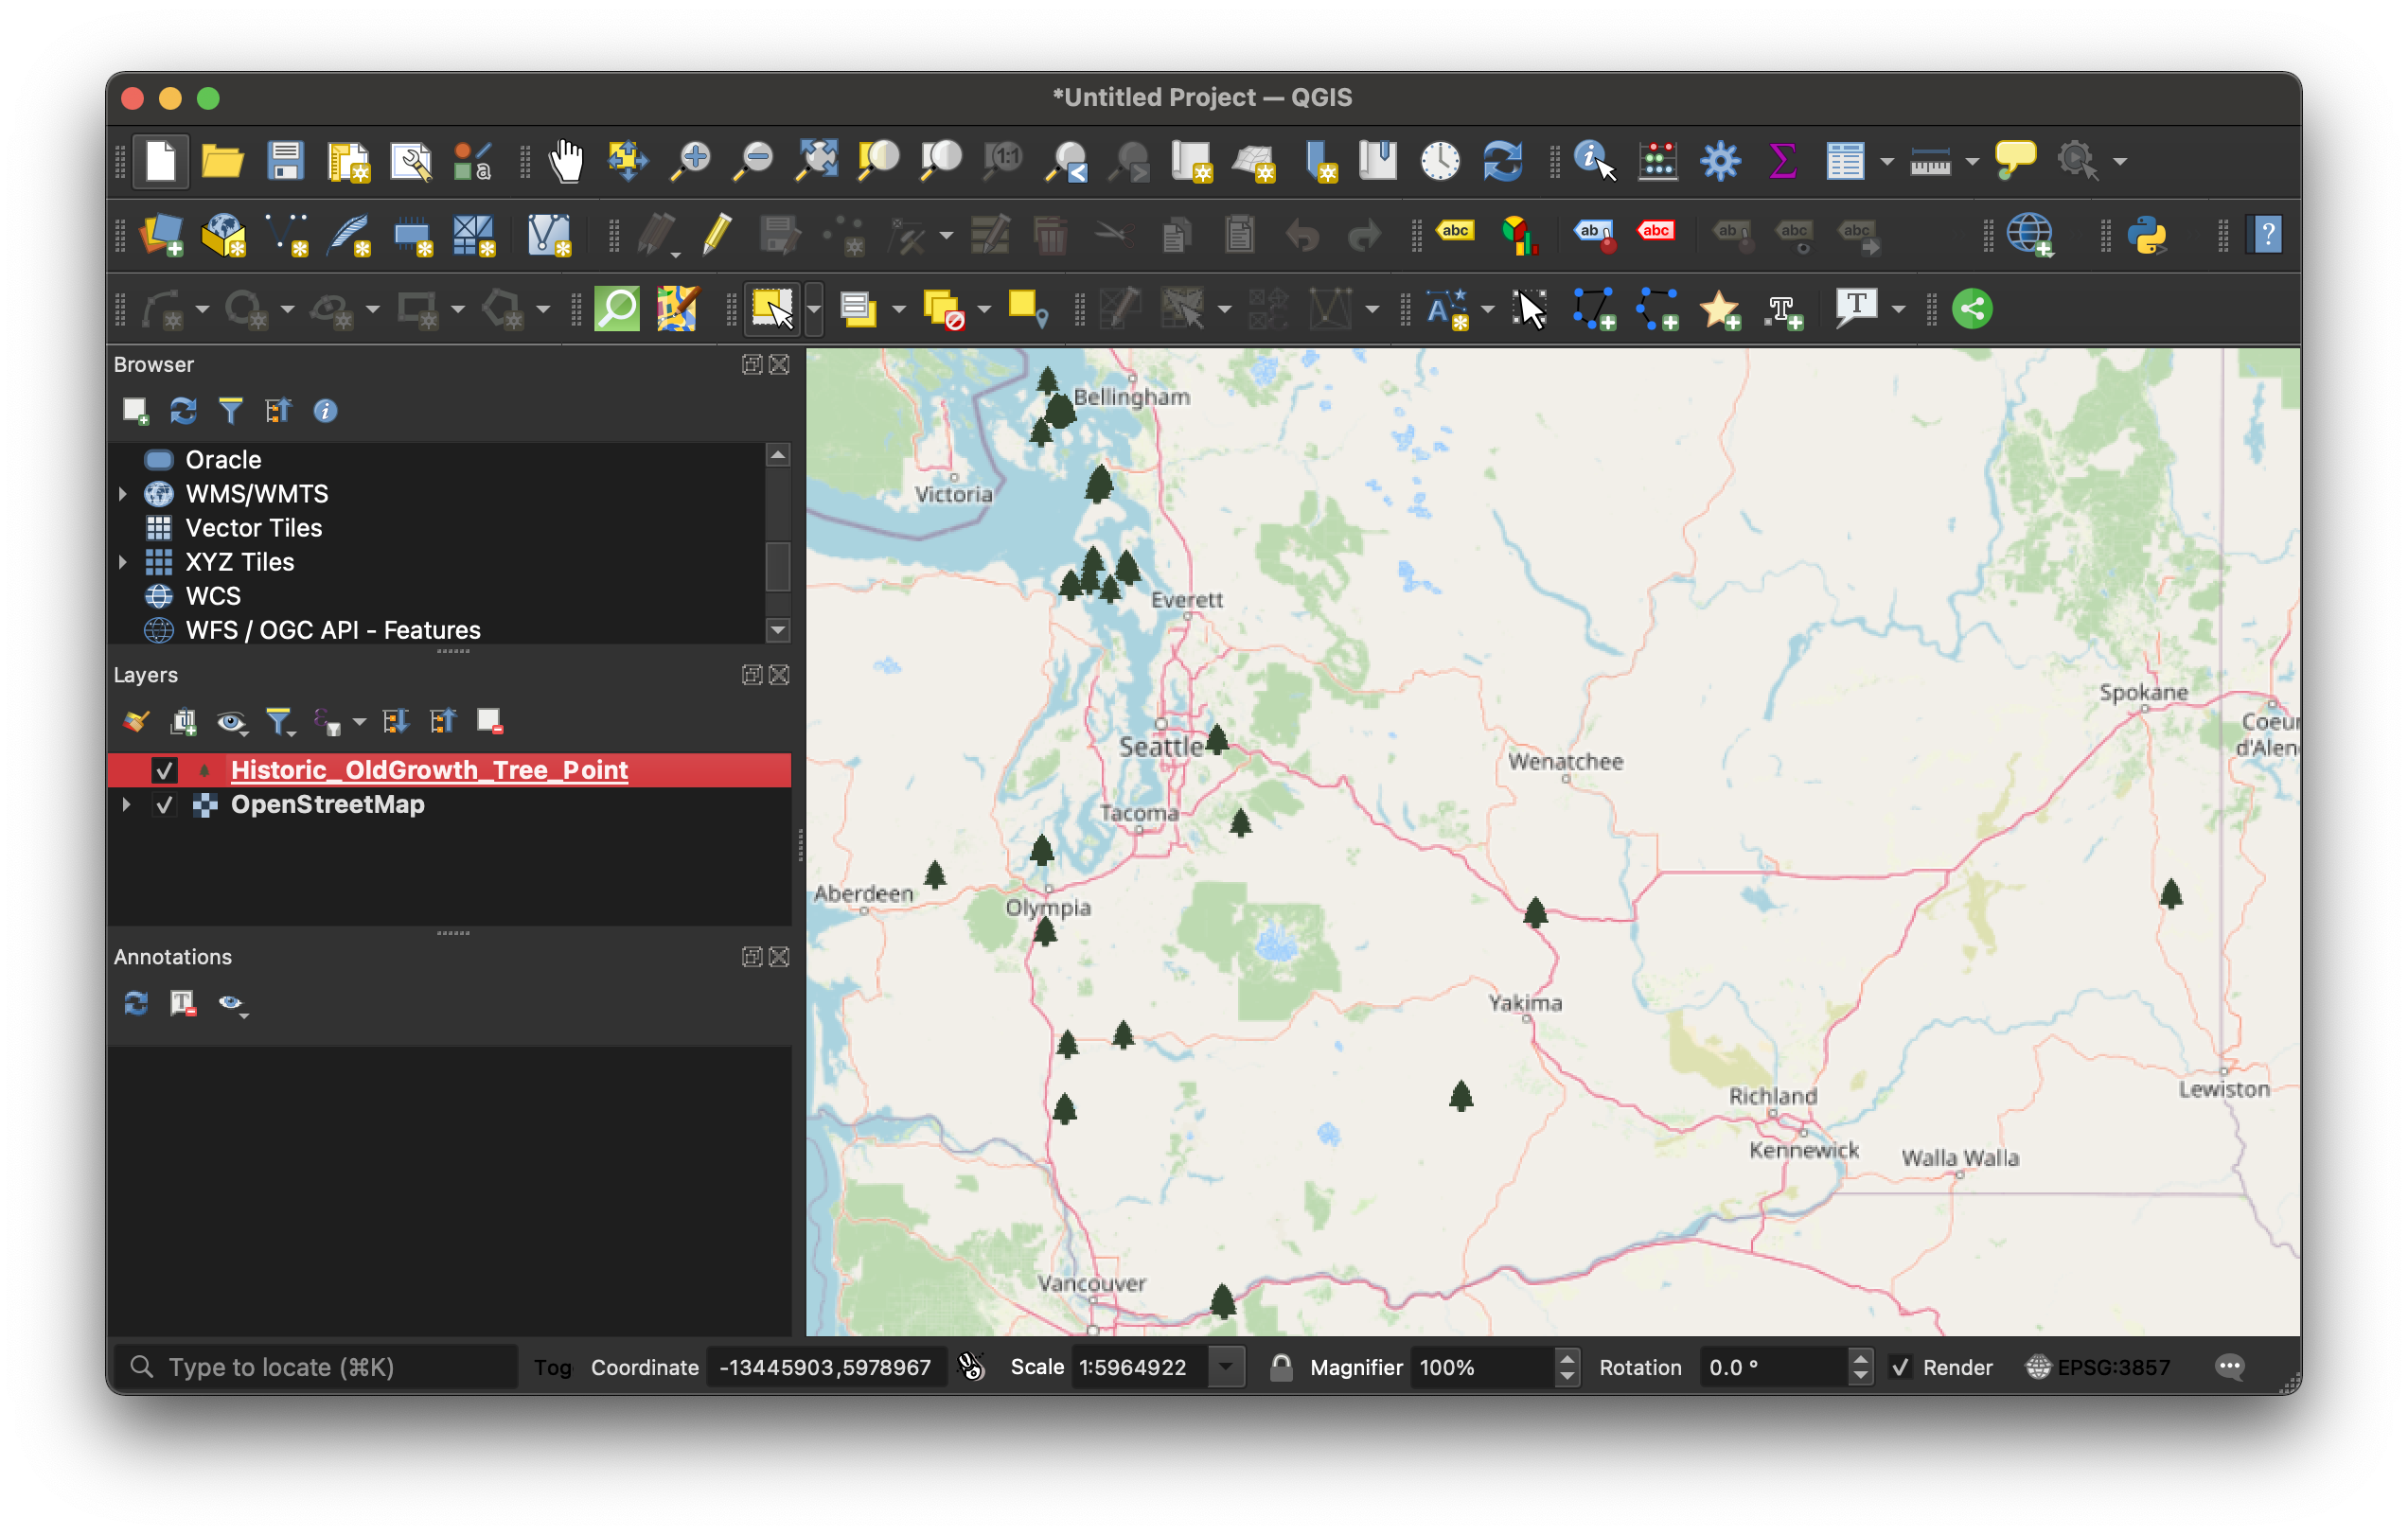
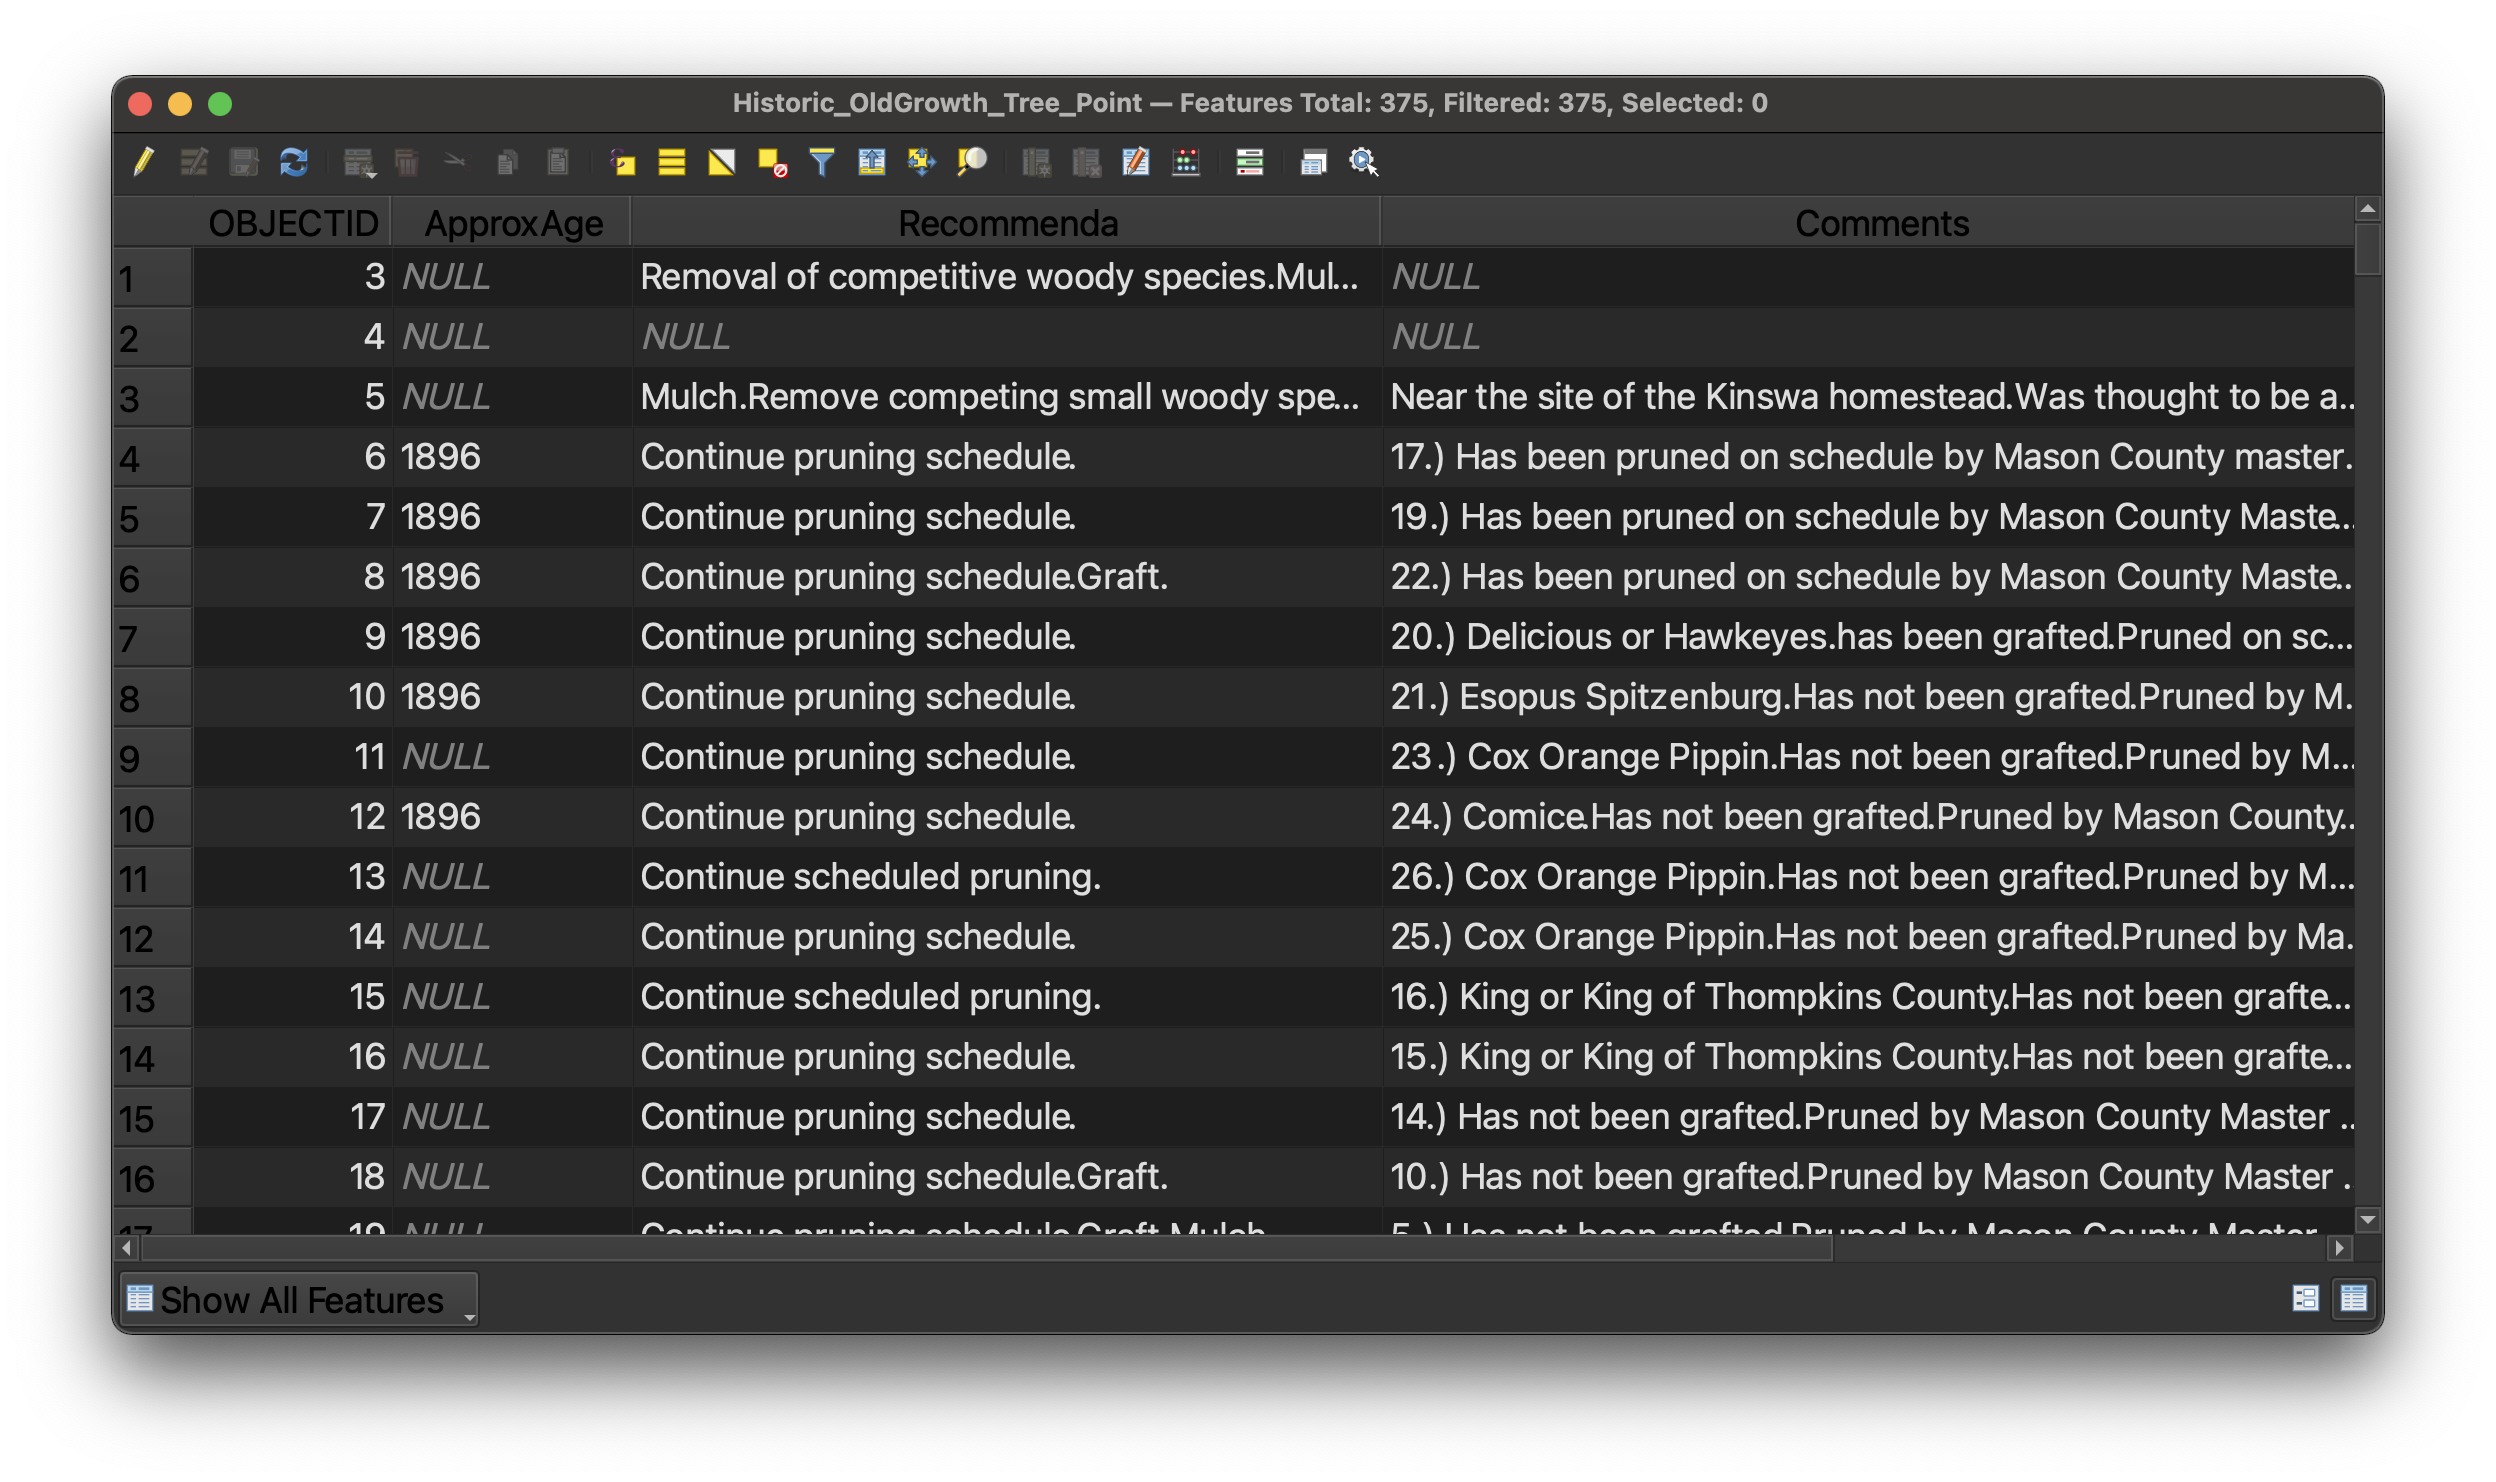
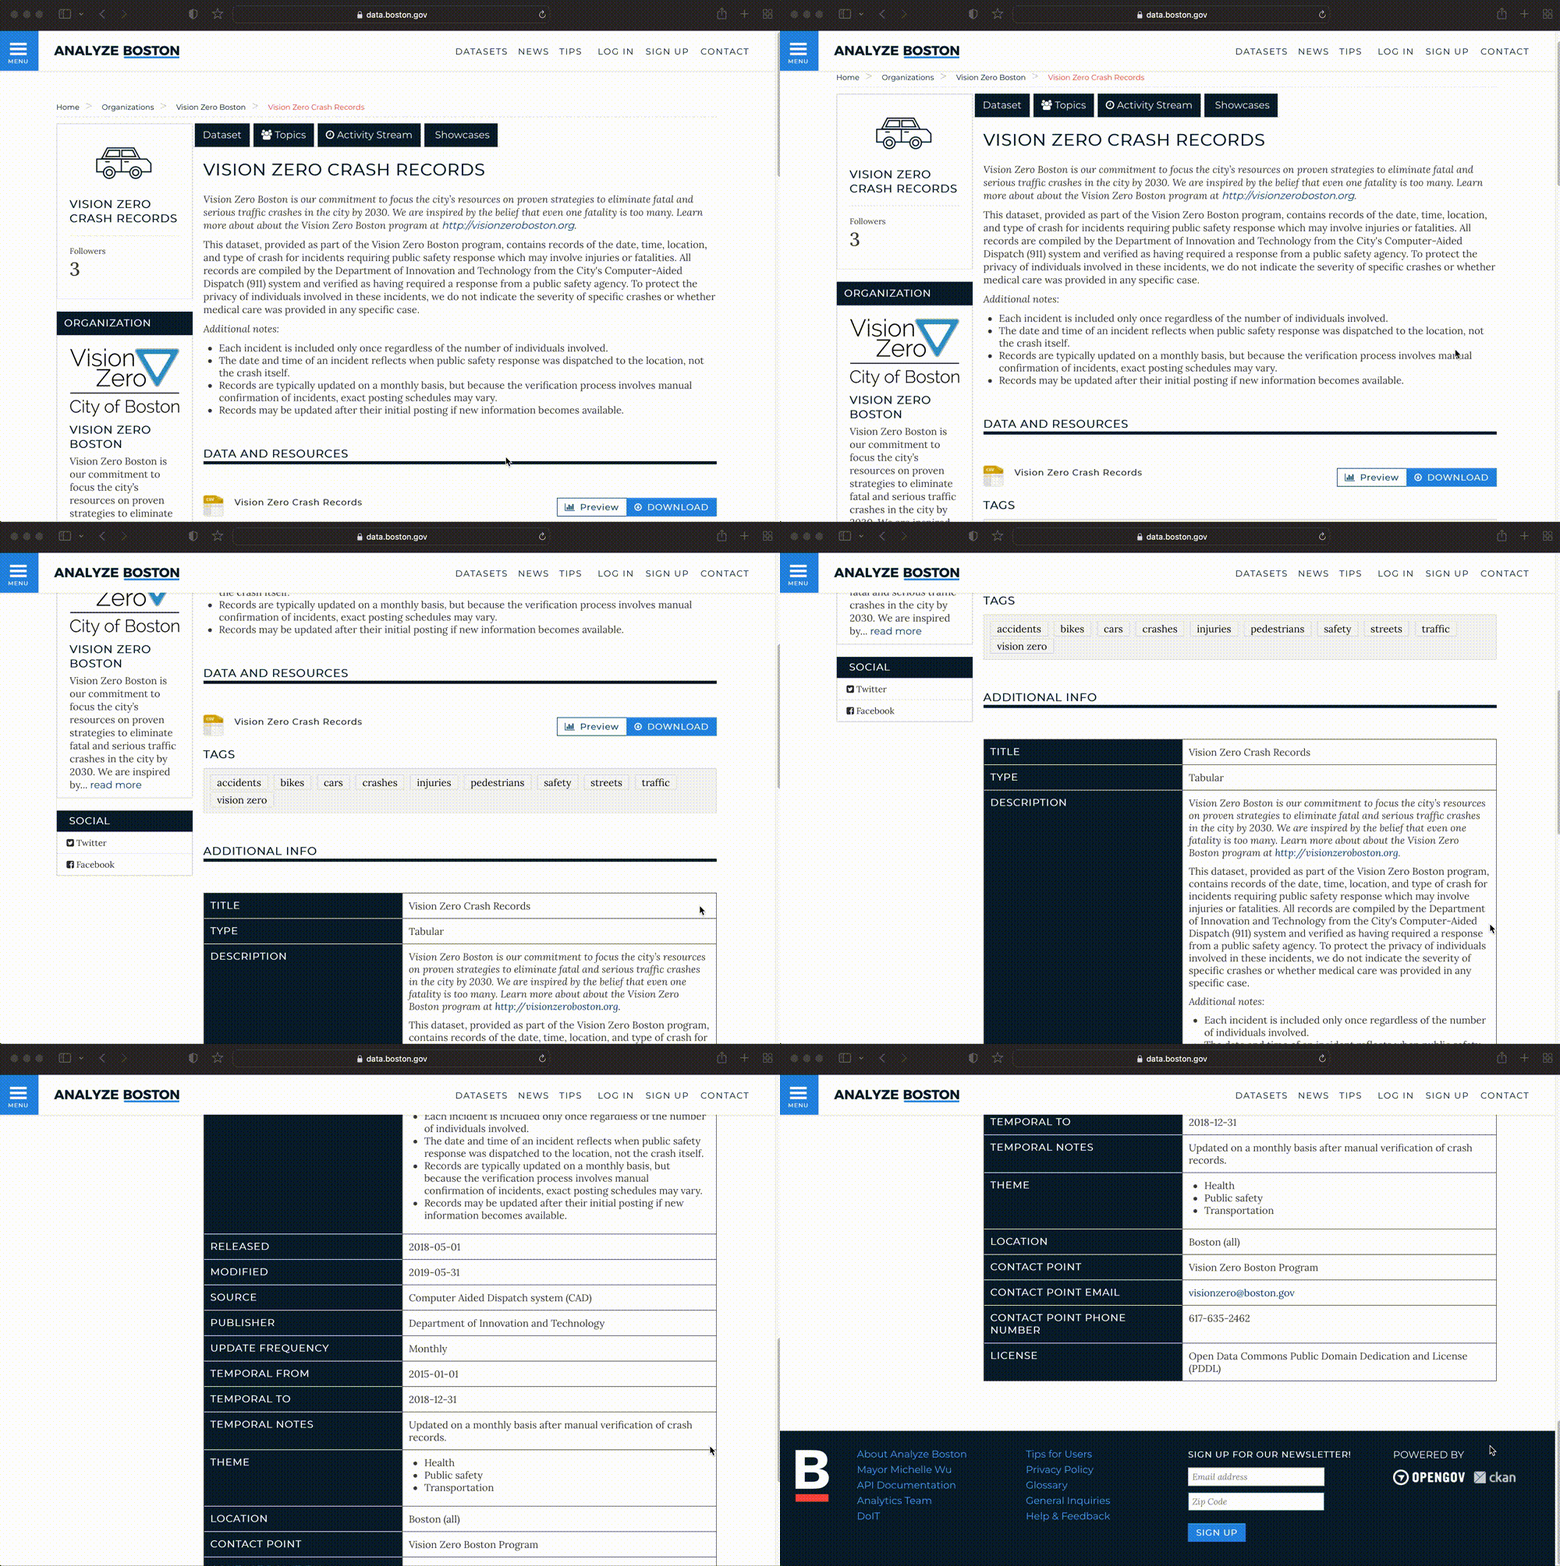 Analyze Boston, Boston’s open data portal.
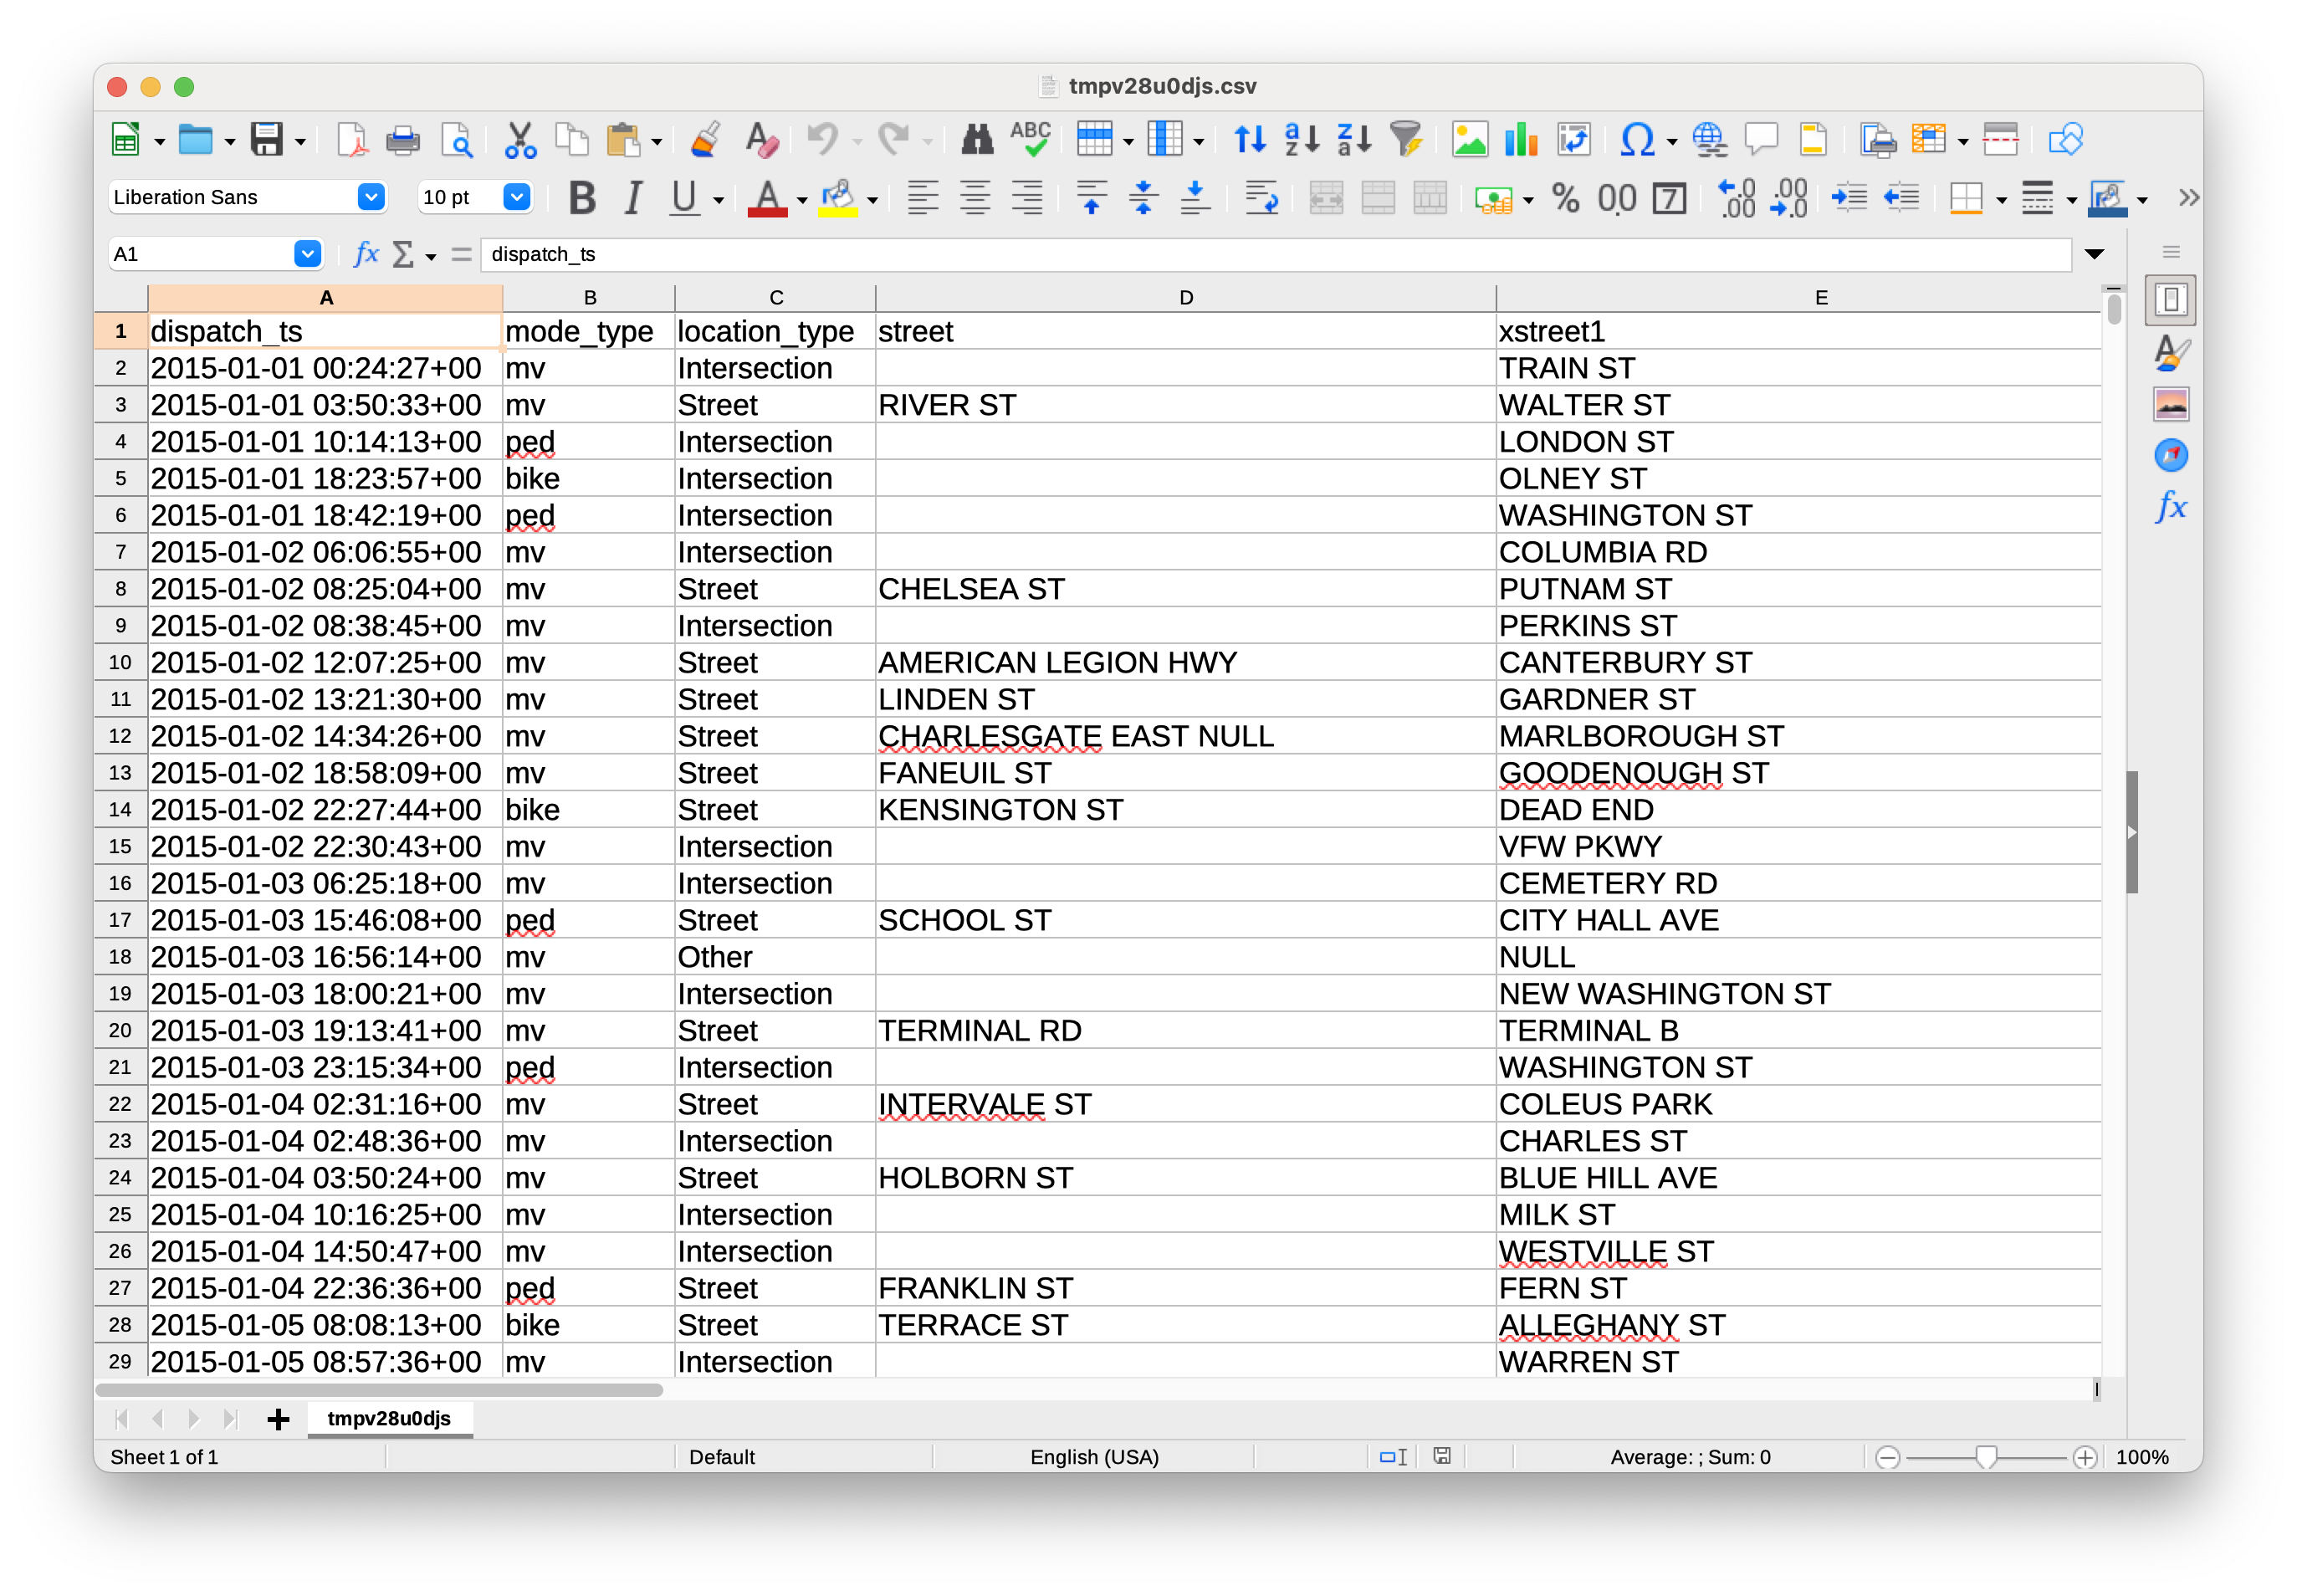 Vision Zero dataset, open as a table.
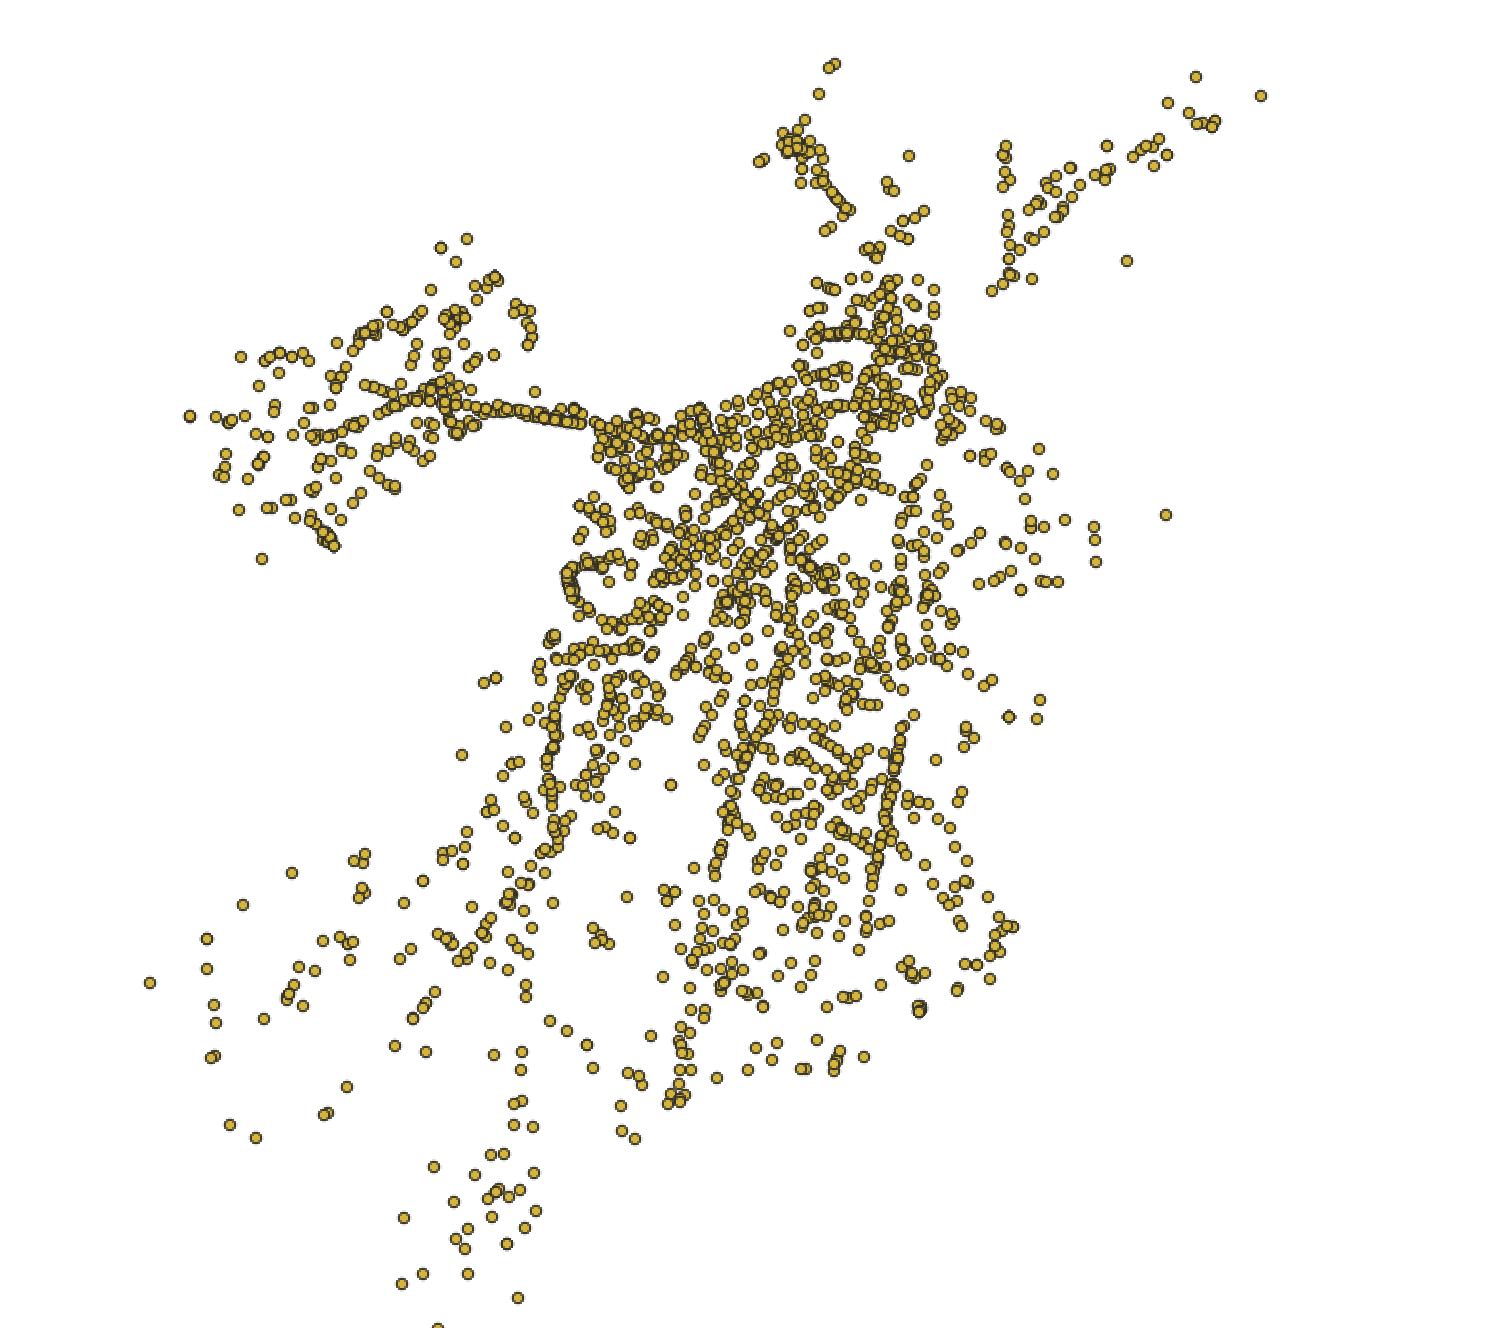 Bike crash data displayed visually as individual points in GIS software.
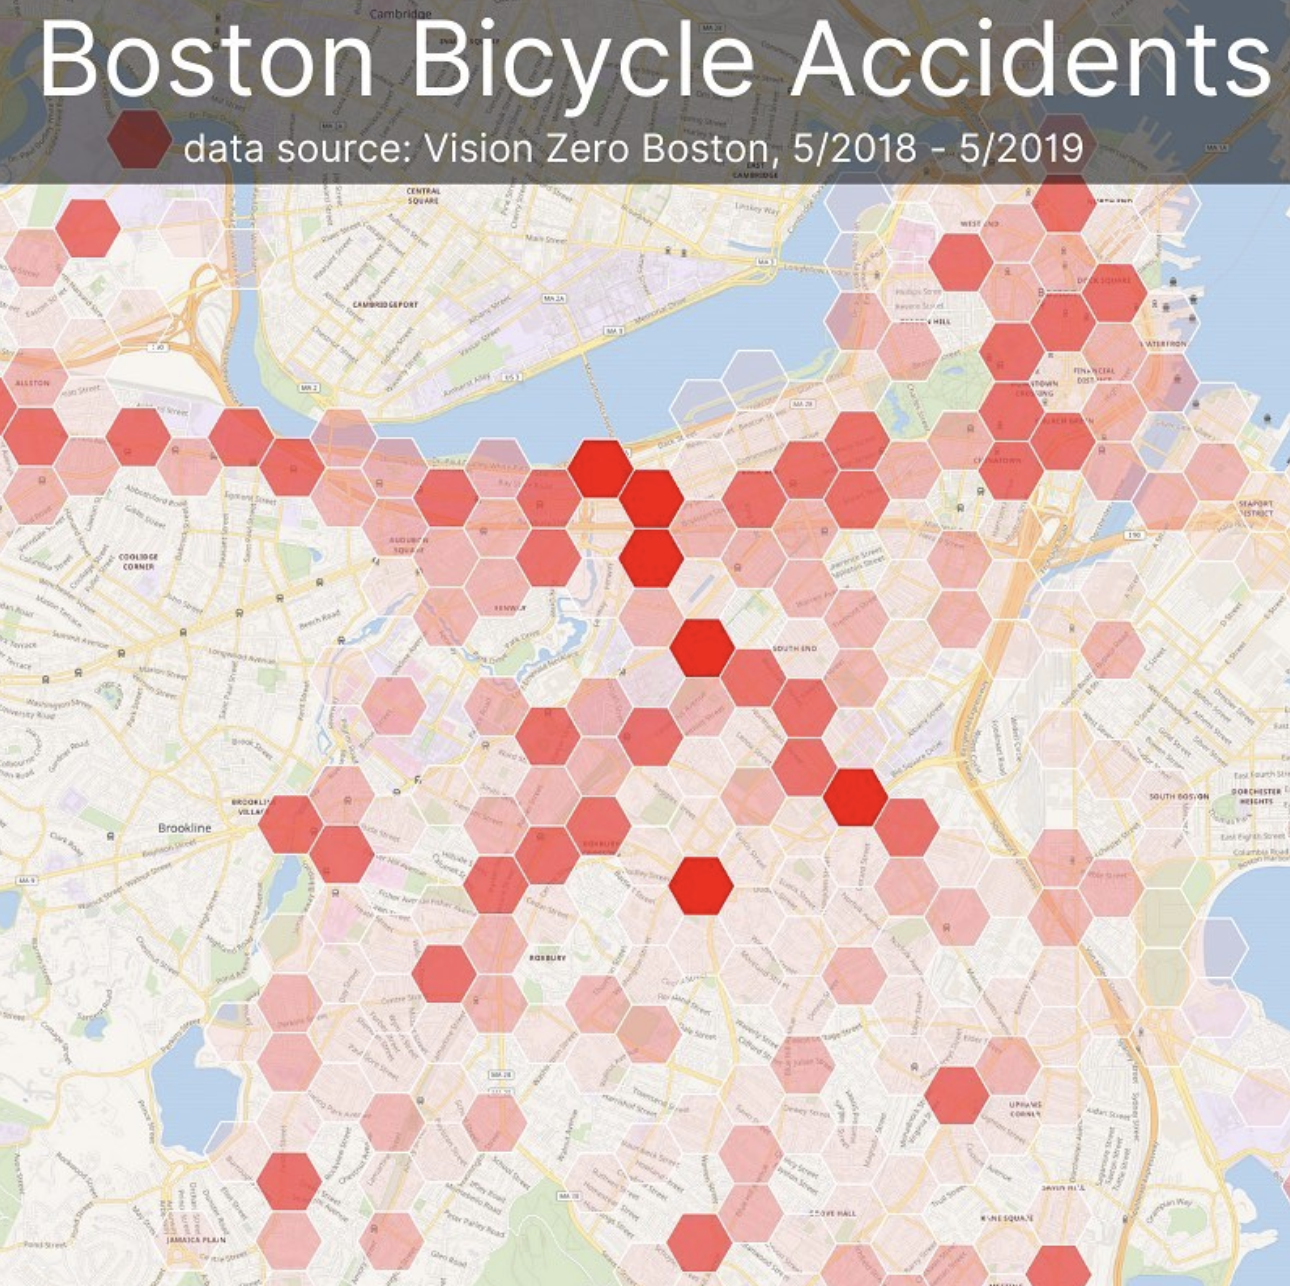

Support team
Example topics we help with mapping:
- gentrification
- rising sea levels
- access to health care
- colonialism and land dispossession
Resources
Making Maps Accessible - Video ~ 9 minutes
Map Accessibility - Webpage with tips and guidelines
Color Oracle - Free color blindness simulator
Color Contrast Checker - Tool for comparing colors